New Features of BO 4.0 WEBI

BO 4.0 provides a lot of exciting new features. Here we will take a look into the important new features of Web Intelligence Reports.
Web Intelligence Reports:
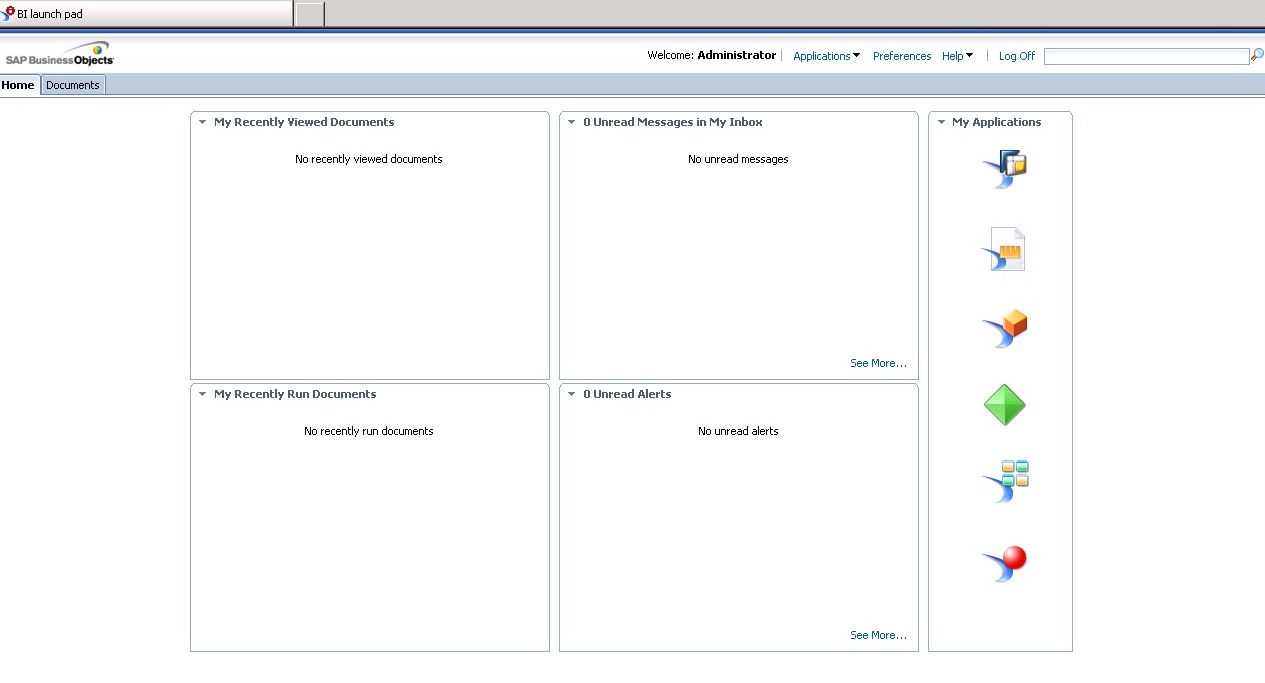
- The Infoview portal which contained WEBI reports has now been renamed to BI Launch Pad. On logging in, a screen like below is visible
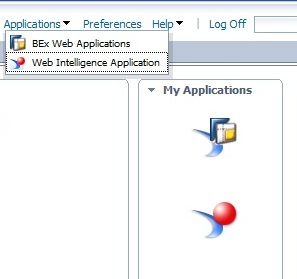
To create a new webi report one needs to click on applications and then Web Intelligence application
- This opens a windows, where one needs to click new to see all the options
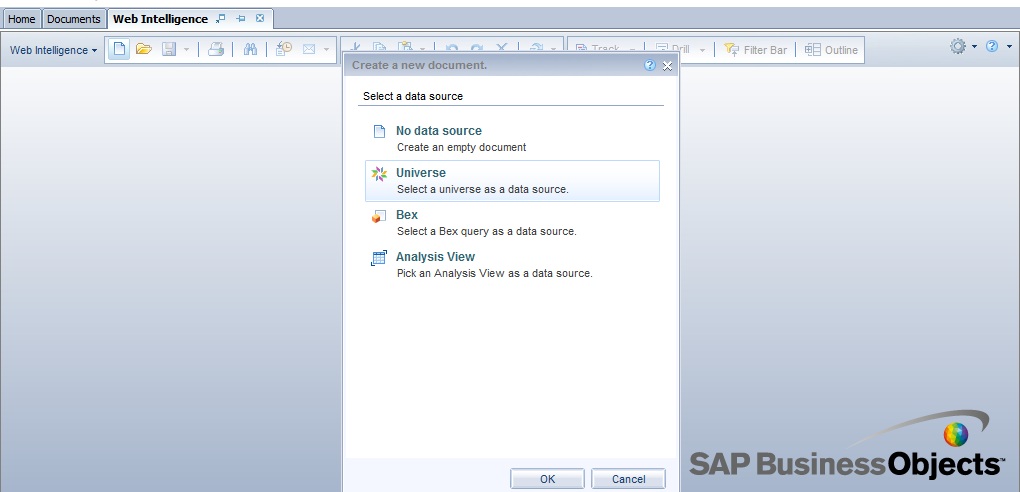
BO 4.0 enables creation of report from Universes as well as BEx Queries and Analysis Views (both related to SAP BW)
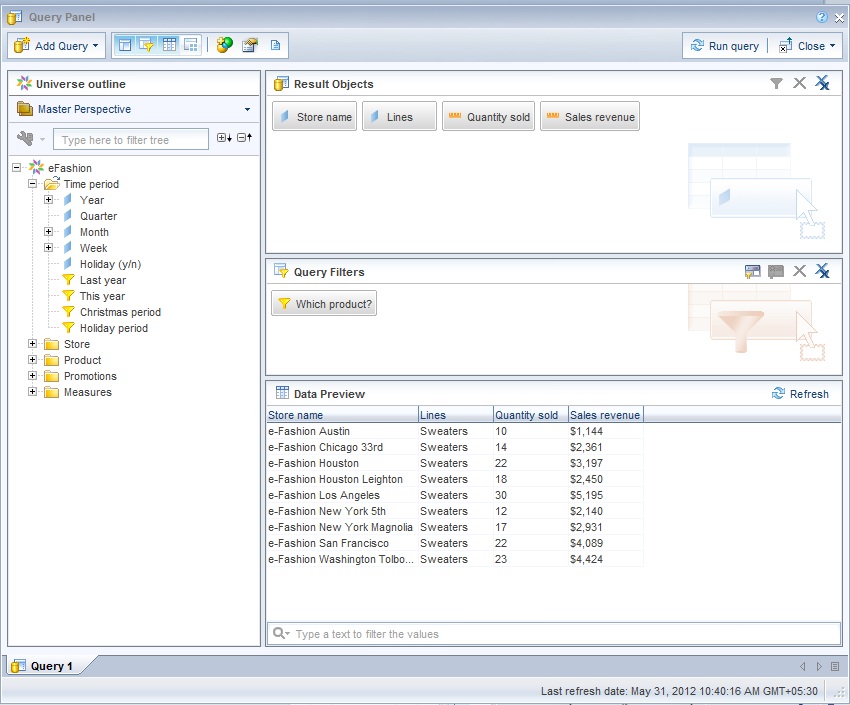
- On selecting any of the options a Query Panel will open. This is similar to the previous versions except that there is a Data Preview pane where the developer can see the data returned by the query without actually running the report
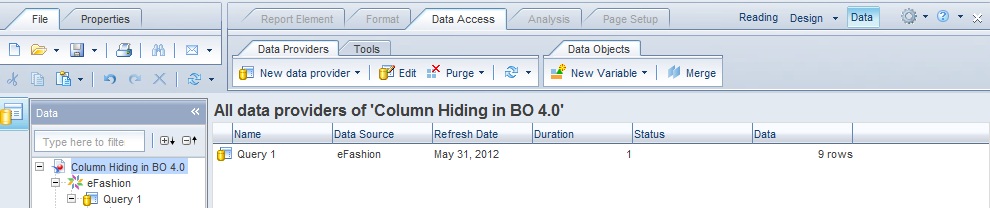
- The Report Panel has a very different look and feel than the previous version with a lot of menus. There are basically three tabs- Reading, Design and Data

When a report is opened in modify mode, all the tabs are visible. However when it is opened in View mode only Reading and Design tabs are visible. The design tab in View Mode gives a user features like Interactive mode in the previous versions.
- It has enhanced copy paste features for Report Objects. Components can be copied from one report to another. This will result in the corresponding queries getting copied. However, I have found this to be not working properly at all times. BO will probably handle this in future patches/service packs
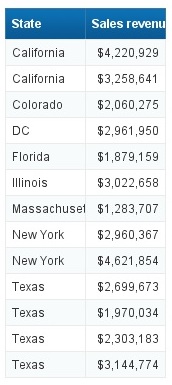
- Dimension Hiding feature, earlier a part of Desktop Intelligence, is now present in Web Intelligence report. For example, let us take a report table as below
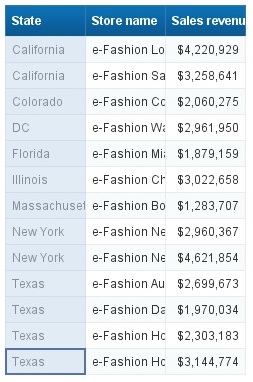
To hide the dimension Store Name
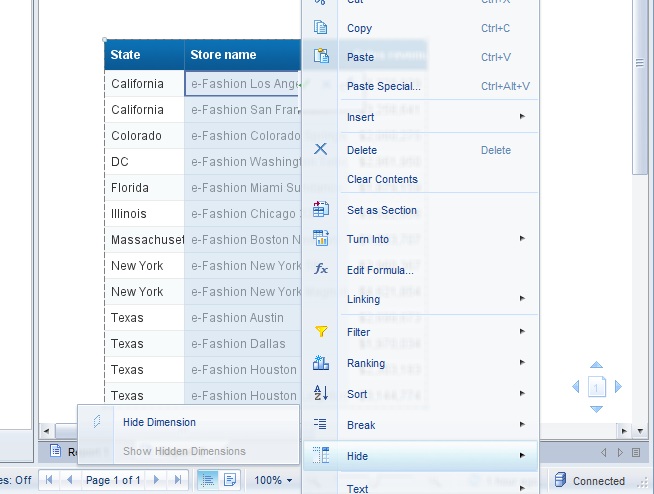
Notice that the dimension is only hidden and not removed (since the measures do not roll up)
This feature is useful when one wants to apply a break on a dimension, but does not want to show it as a column
- Components like tables/charts etc can be Hidden based on conditions.
One needs to right click and go to Format Table/Chart and enter the condition
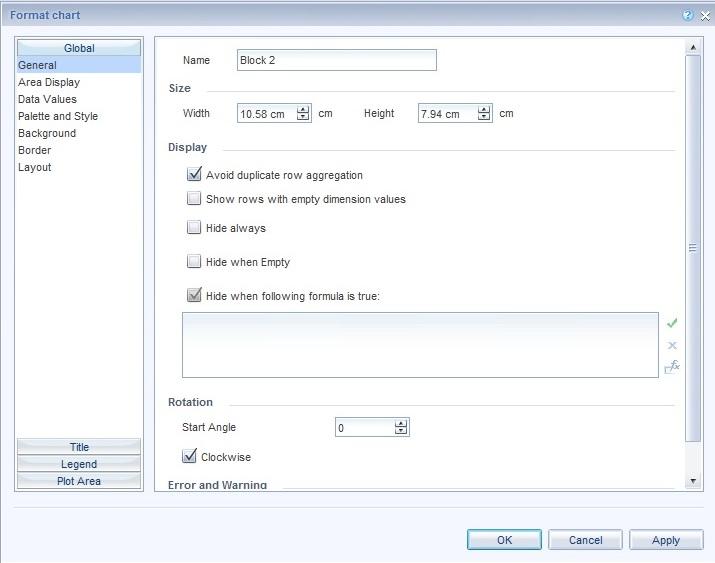
This feature makes implementation of dynamic requirements very easy
- Element Linking features enable linking between two components within the same report and dynamically changing the values of one component through the other.
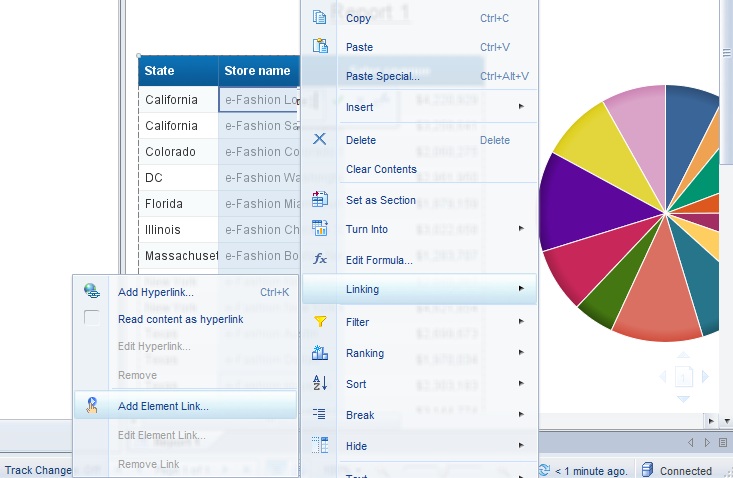
The linking is done based on a dimension just like an input control. The values selected from the master component work like an input control to the dependent component. This will be covered in details in a separate article.
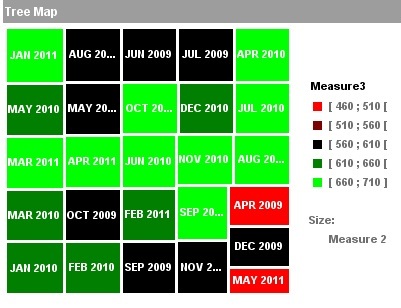
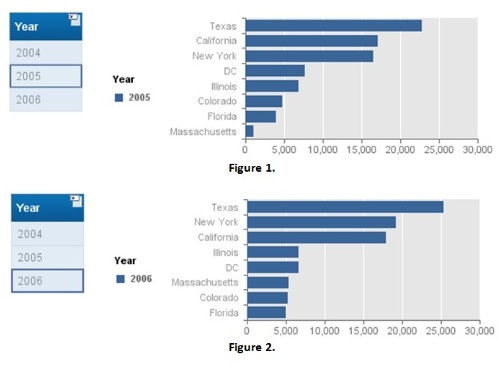
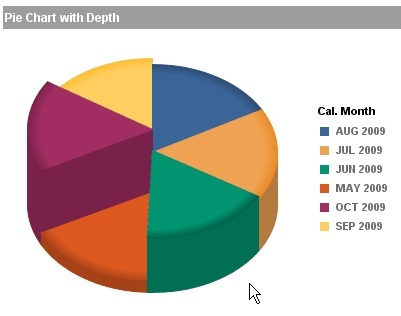
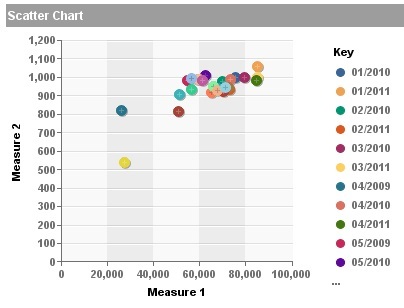
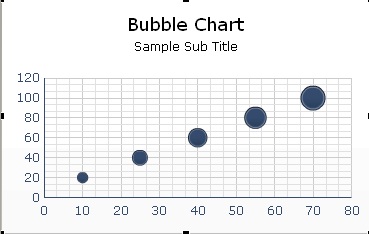
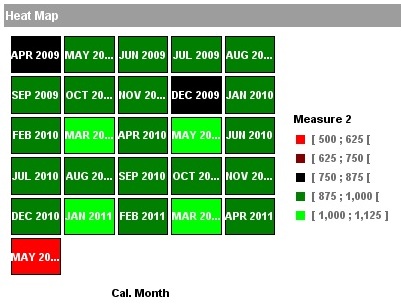
- It has some added Chart types
Pie Charts with depth
Scatter Charts
Bubble Chart
Heat Map
Tree Map