Data Analysis using BigQuery

In this article we are going to setup Google BigQuery for Data Analytics as well as Google Data Studio for Visualization.
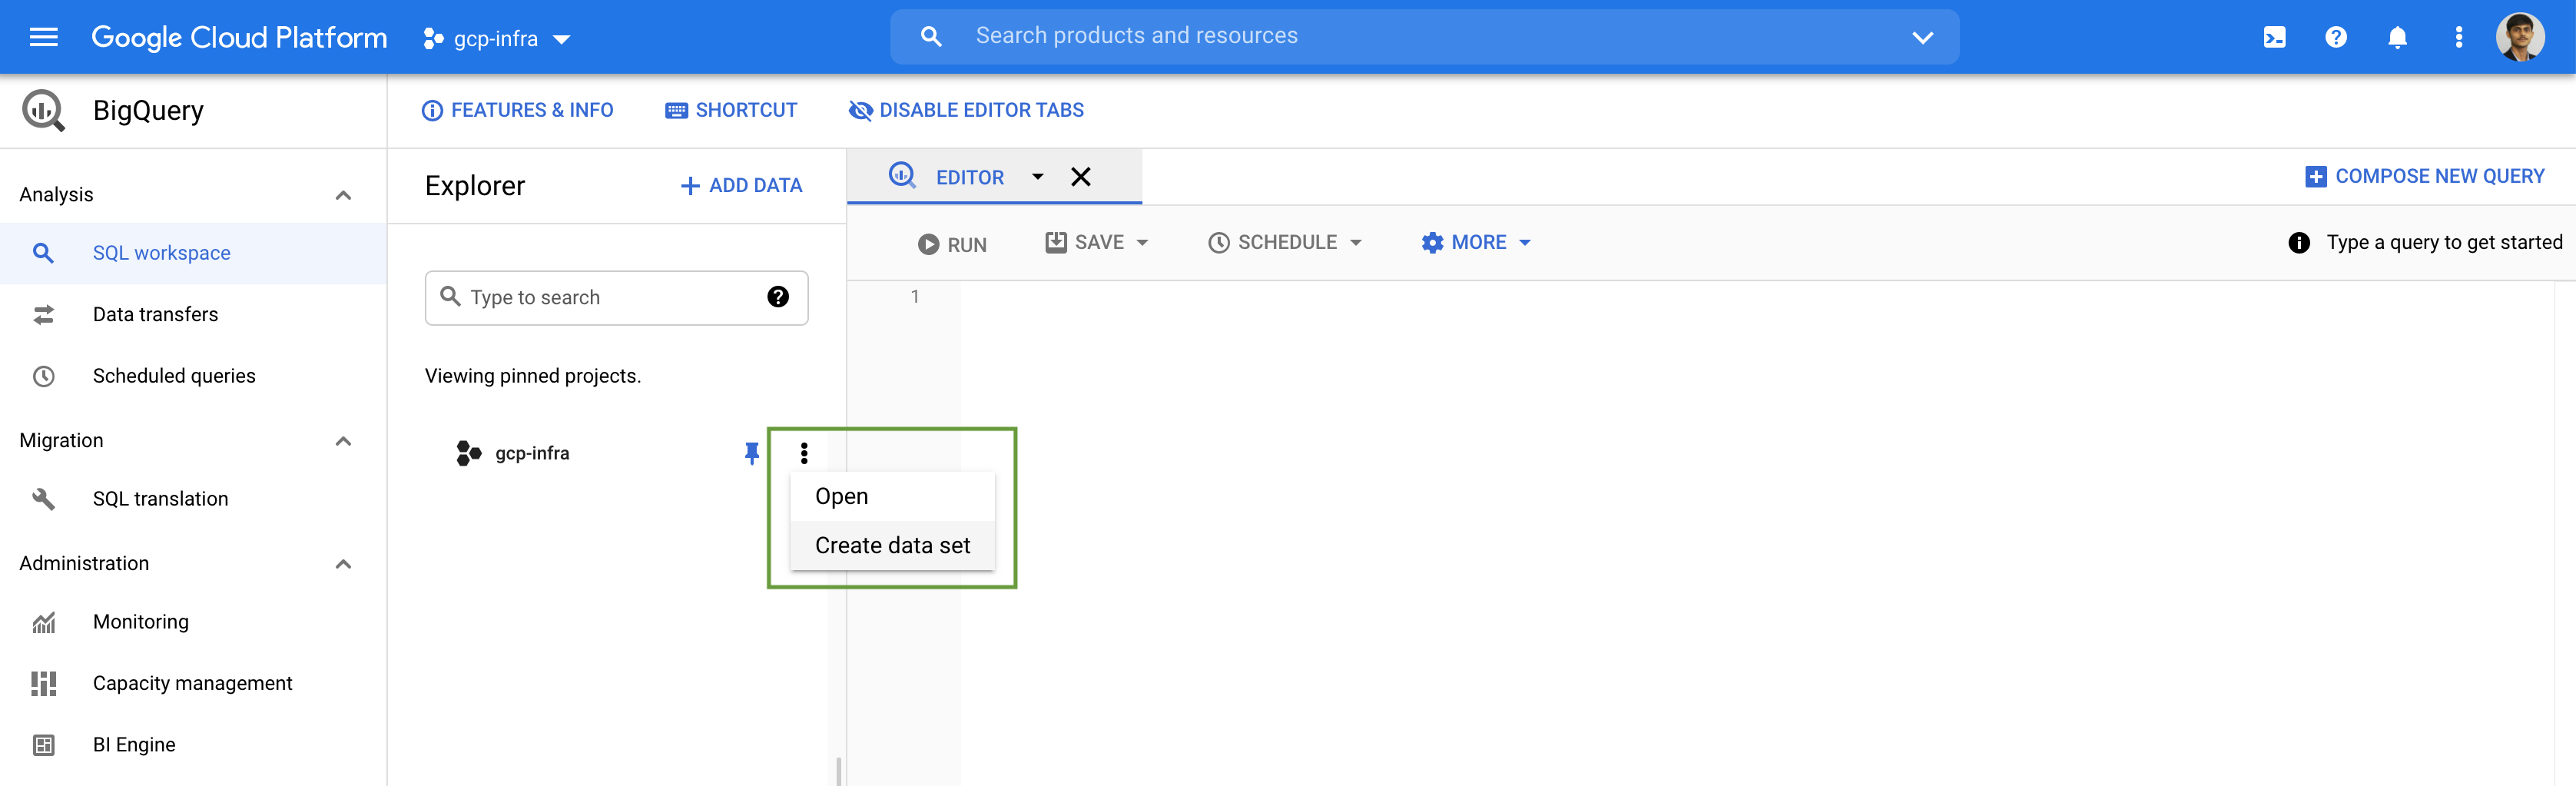
First let's go to BigQuery service https://console.cloud.google.com/bigquery and create a dataset inside our google project.
Datasets are top-level logical containers that are used to organize and control access to BigQuery resources like tables and views. A dataset is contained within a specific project. Datasets are similar to schemas in other database systems. We can set the geographic location of the dataset at creation time only.
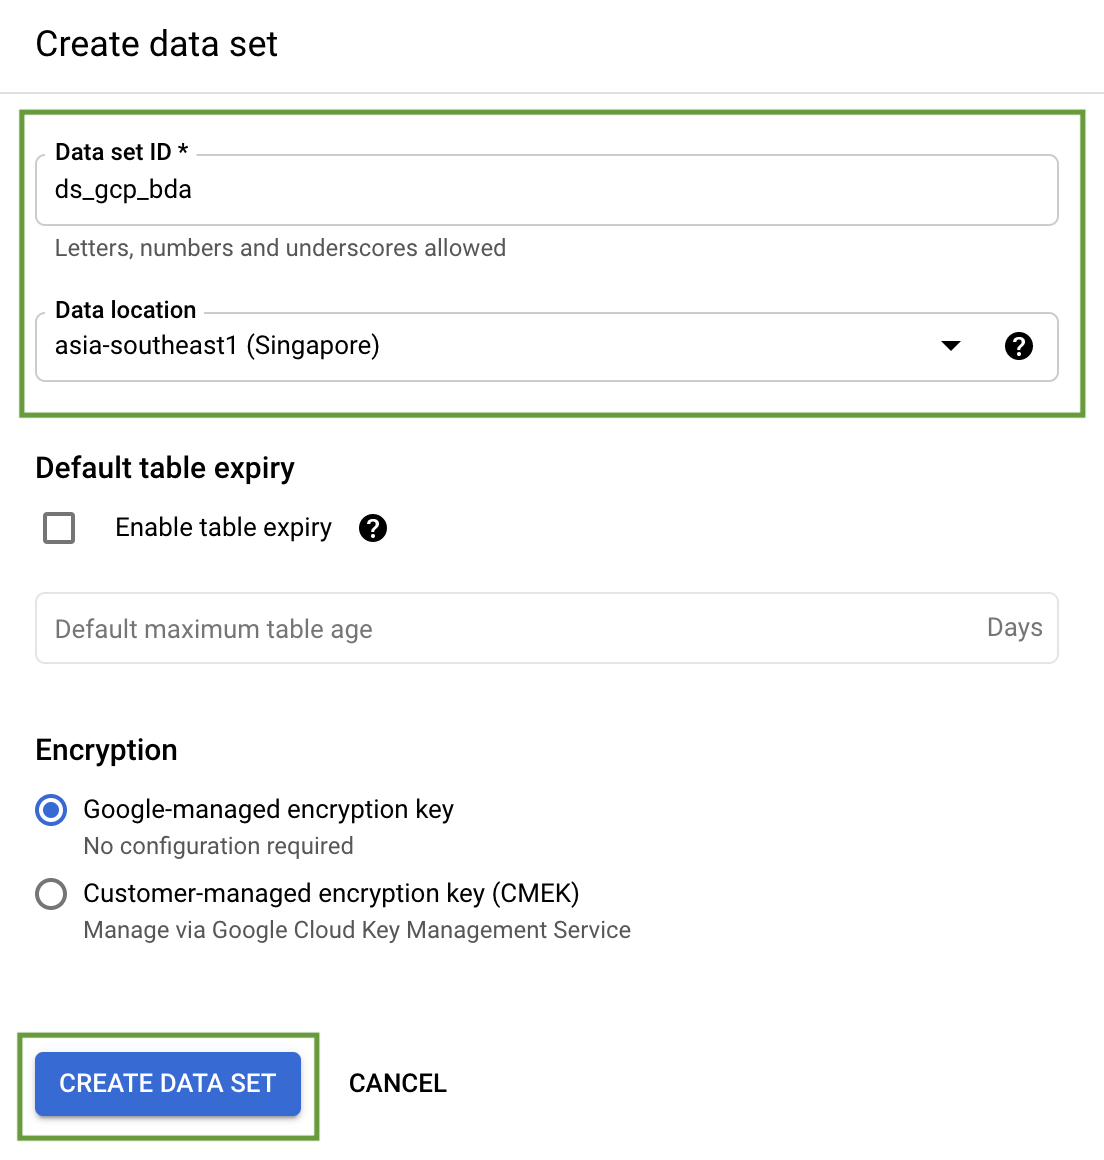
Add a name & a data location for the Dataset.
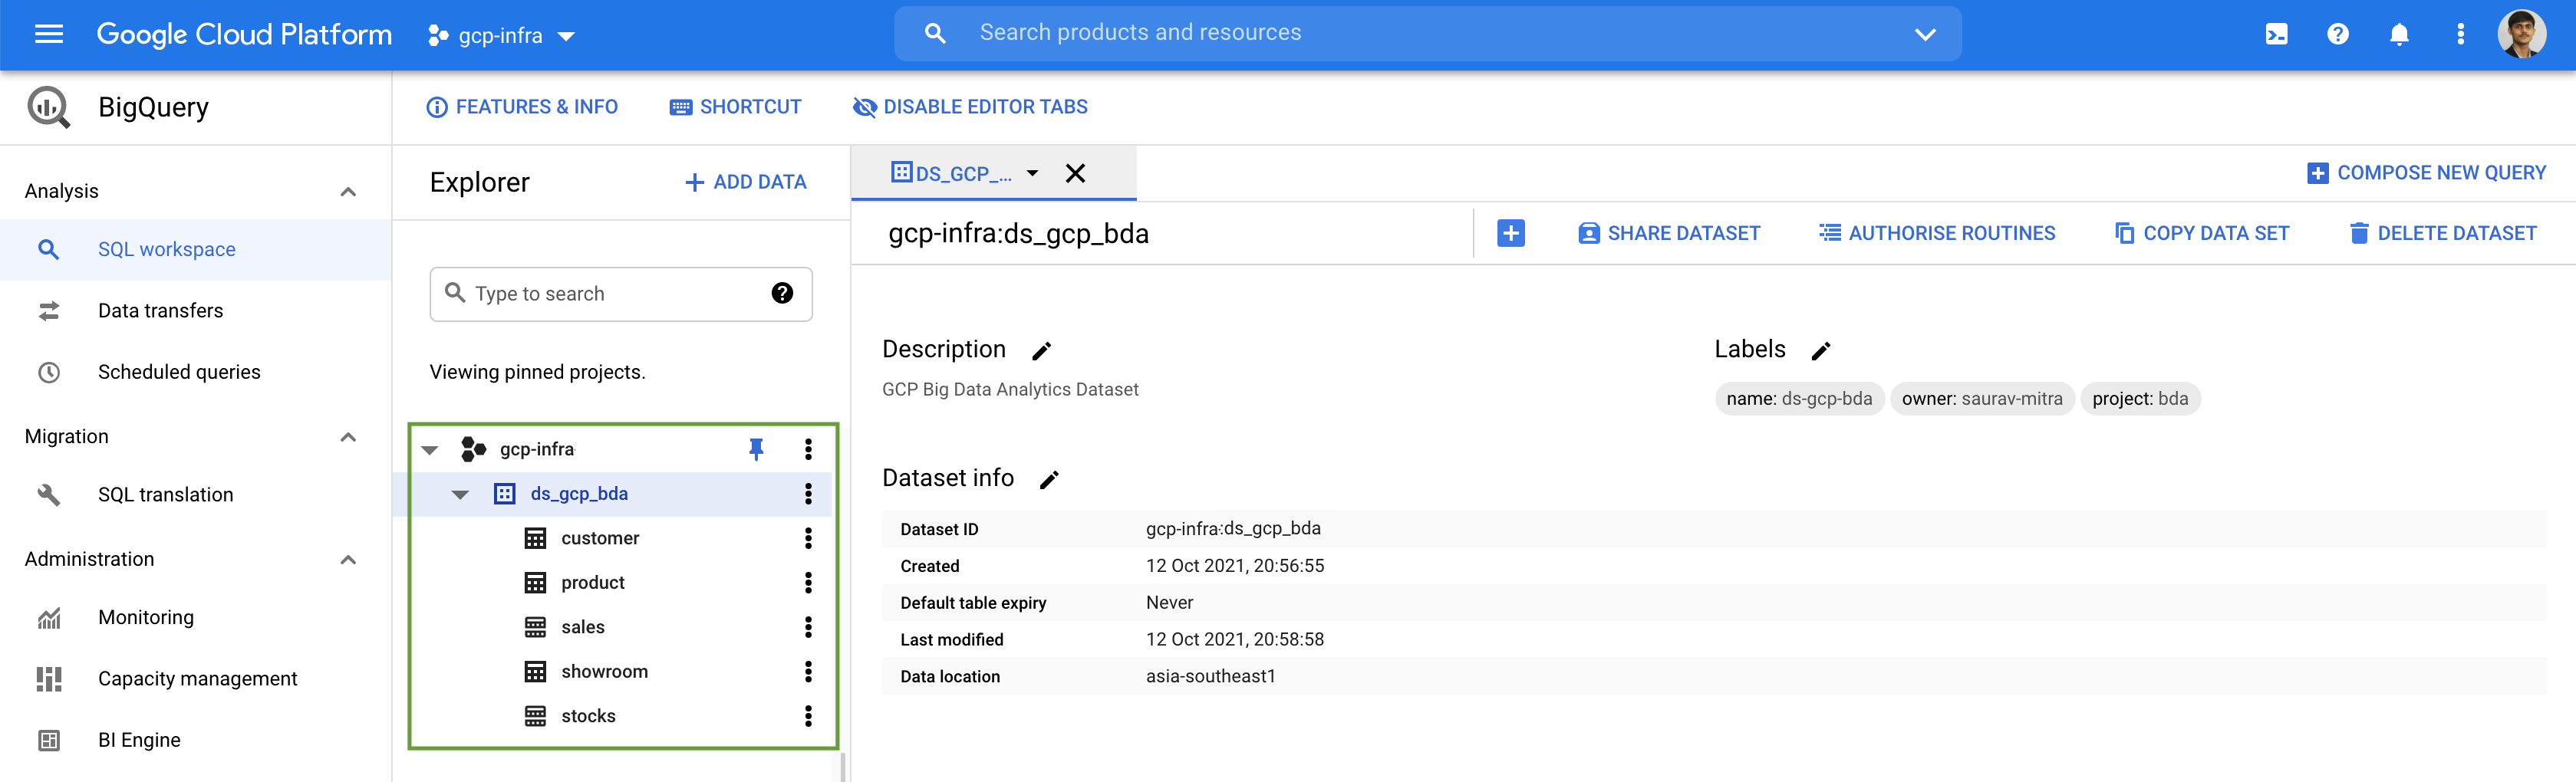
Now within our dataset we will create our BigQuery Tables.
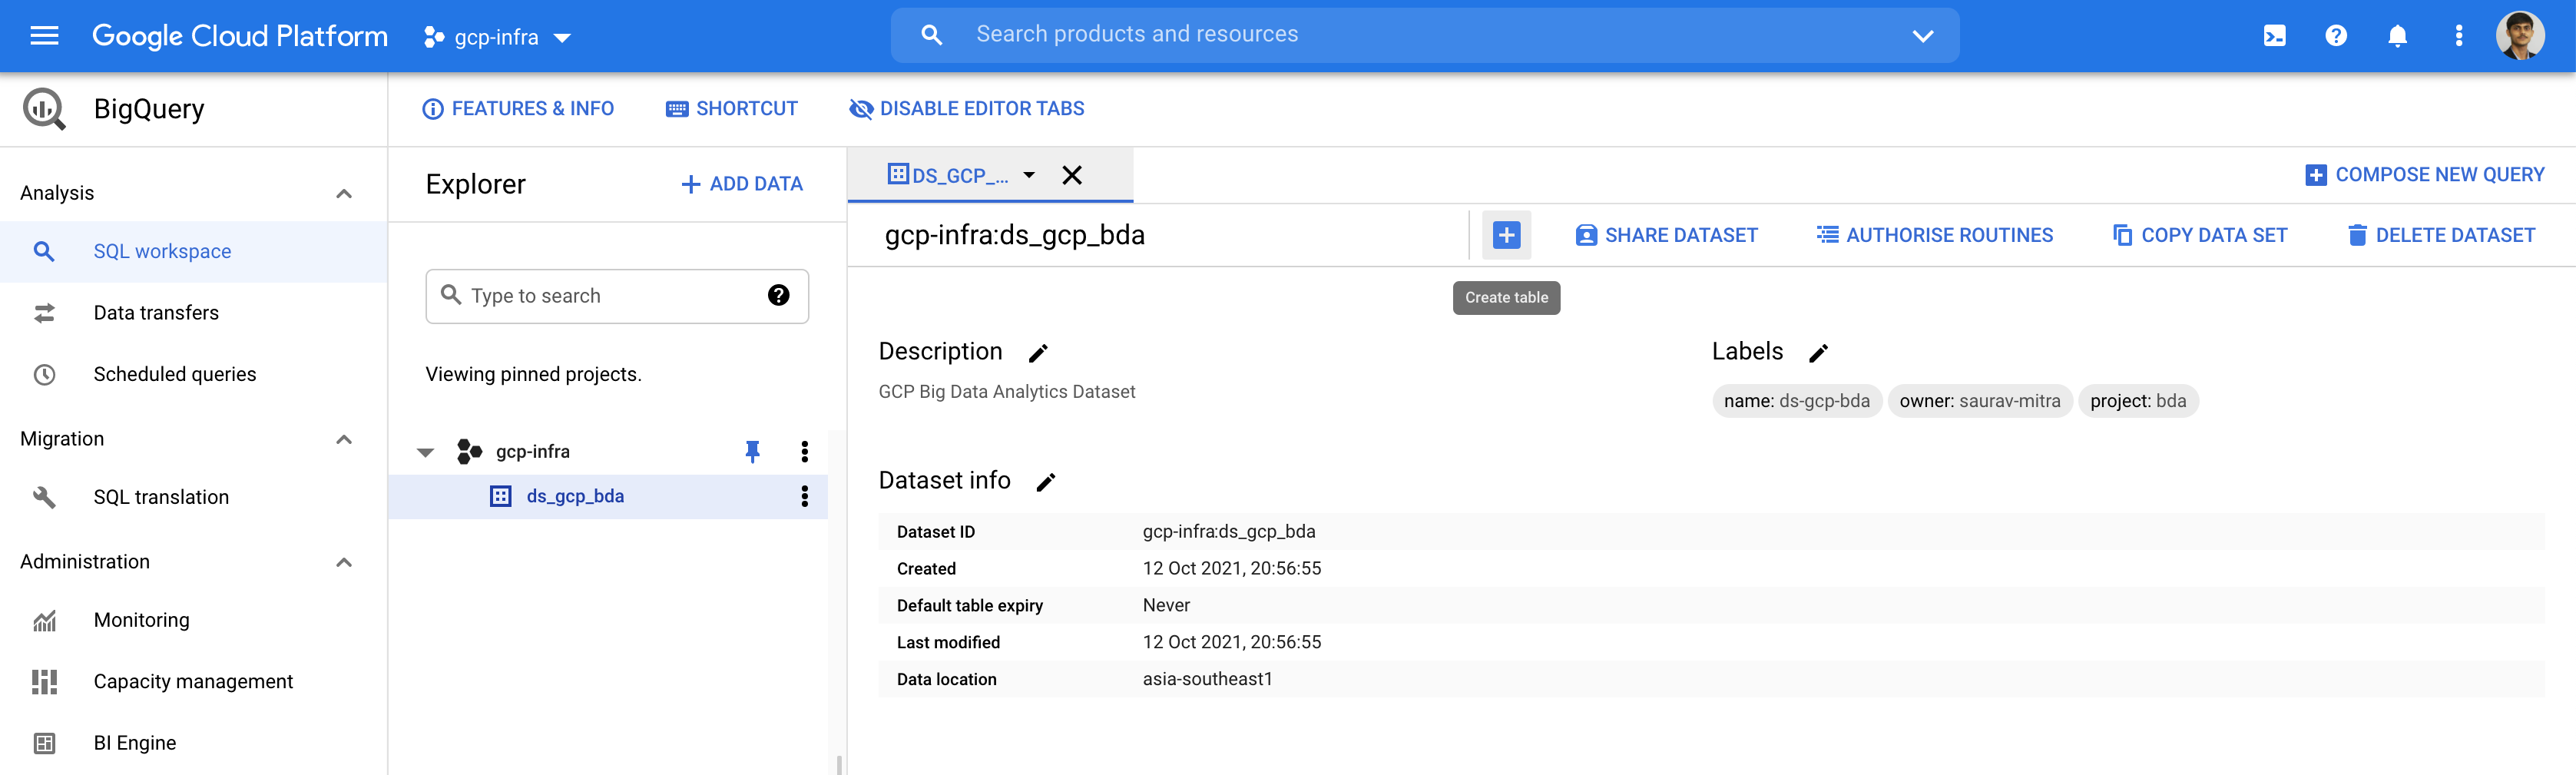
A table or view must belong to a dataset, so we need to create at least one dataset before loading data into BigQuery. BigQuery resources such as tables, views, functions, and procedures are created inside a dataset.
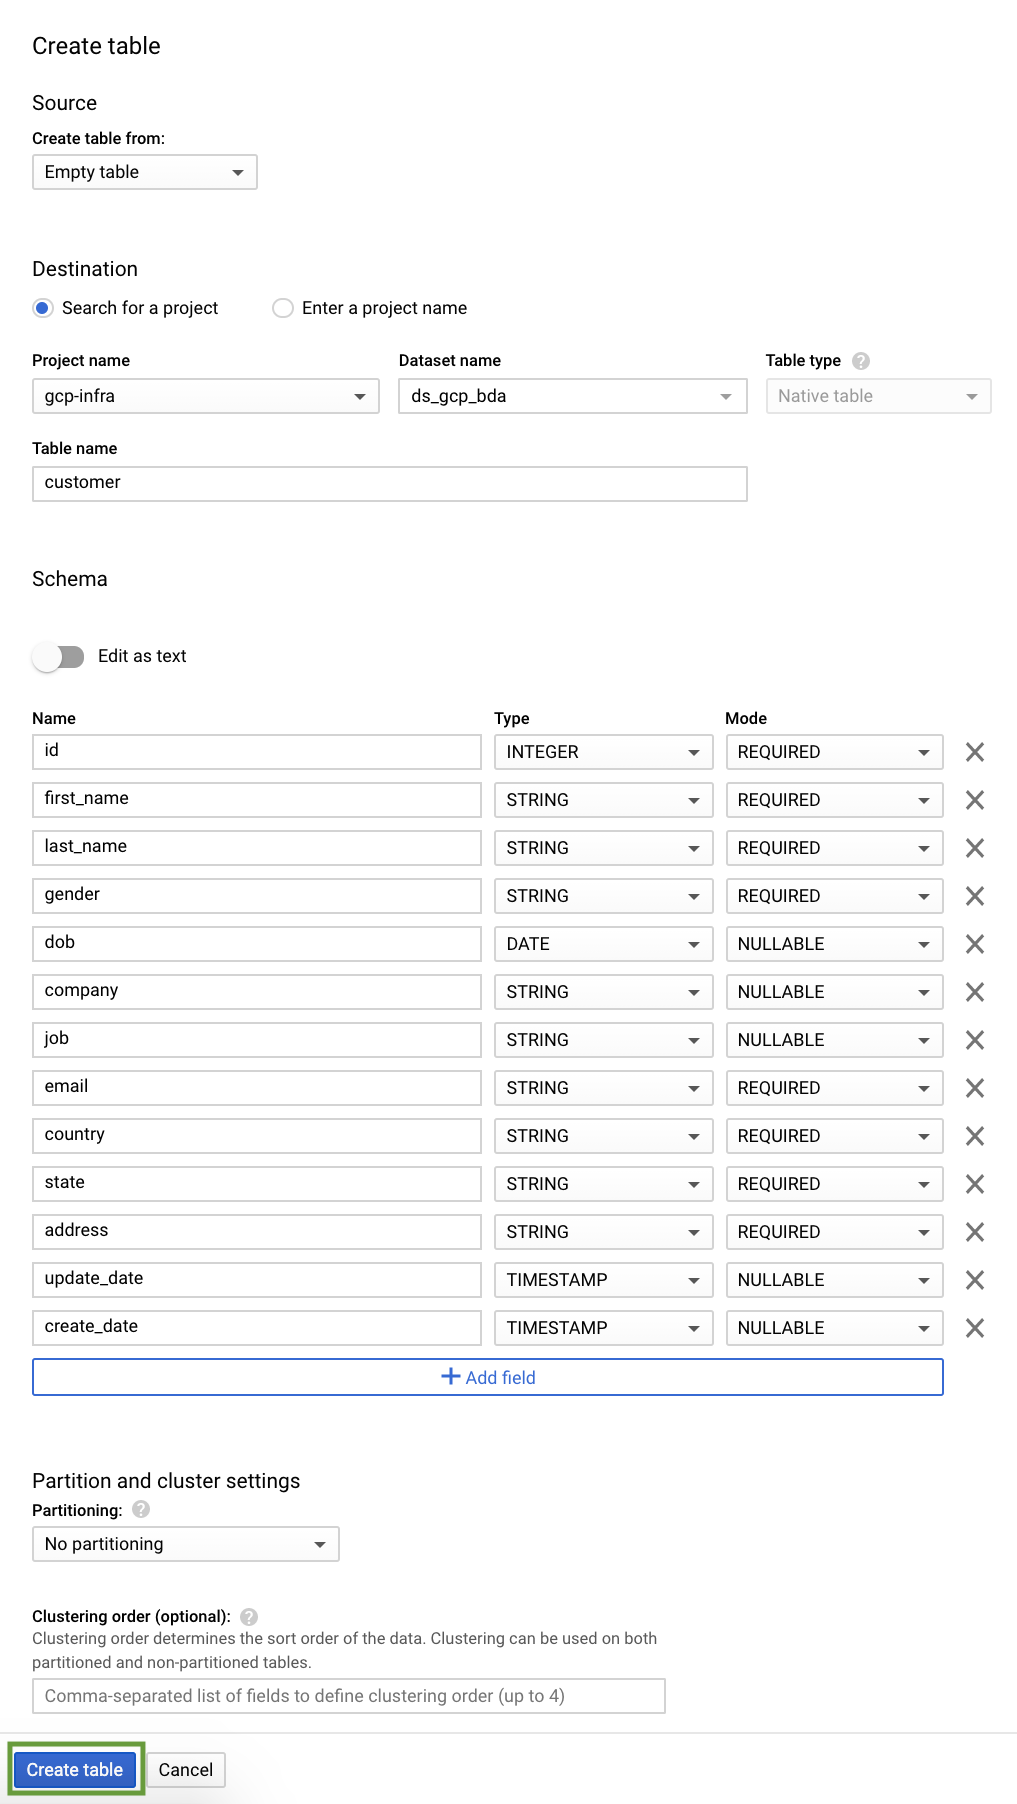
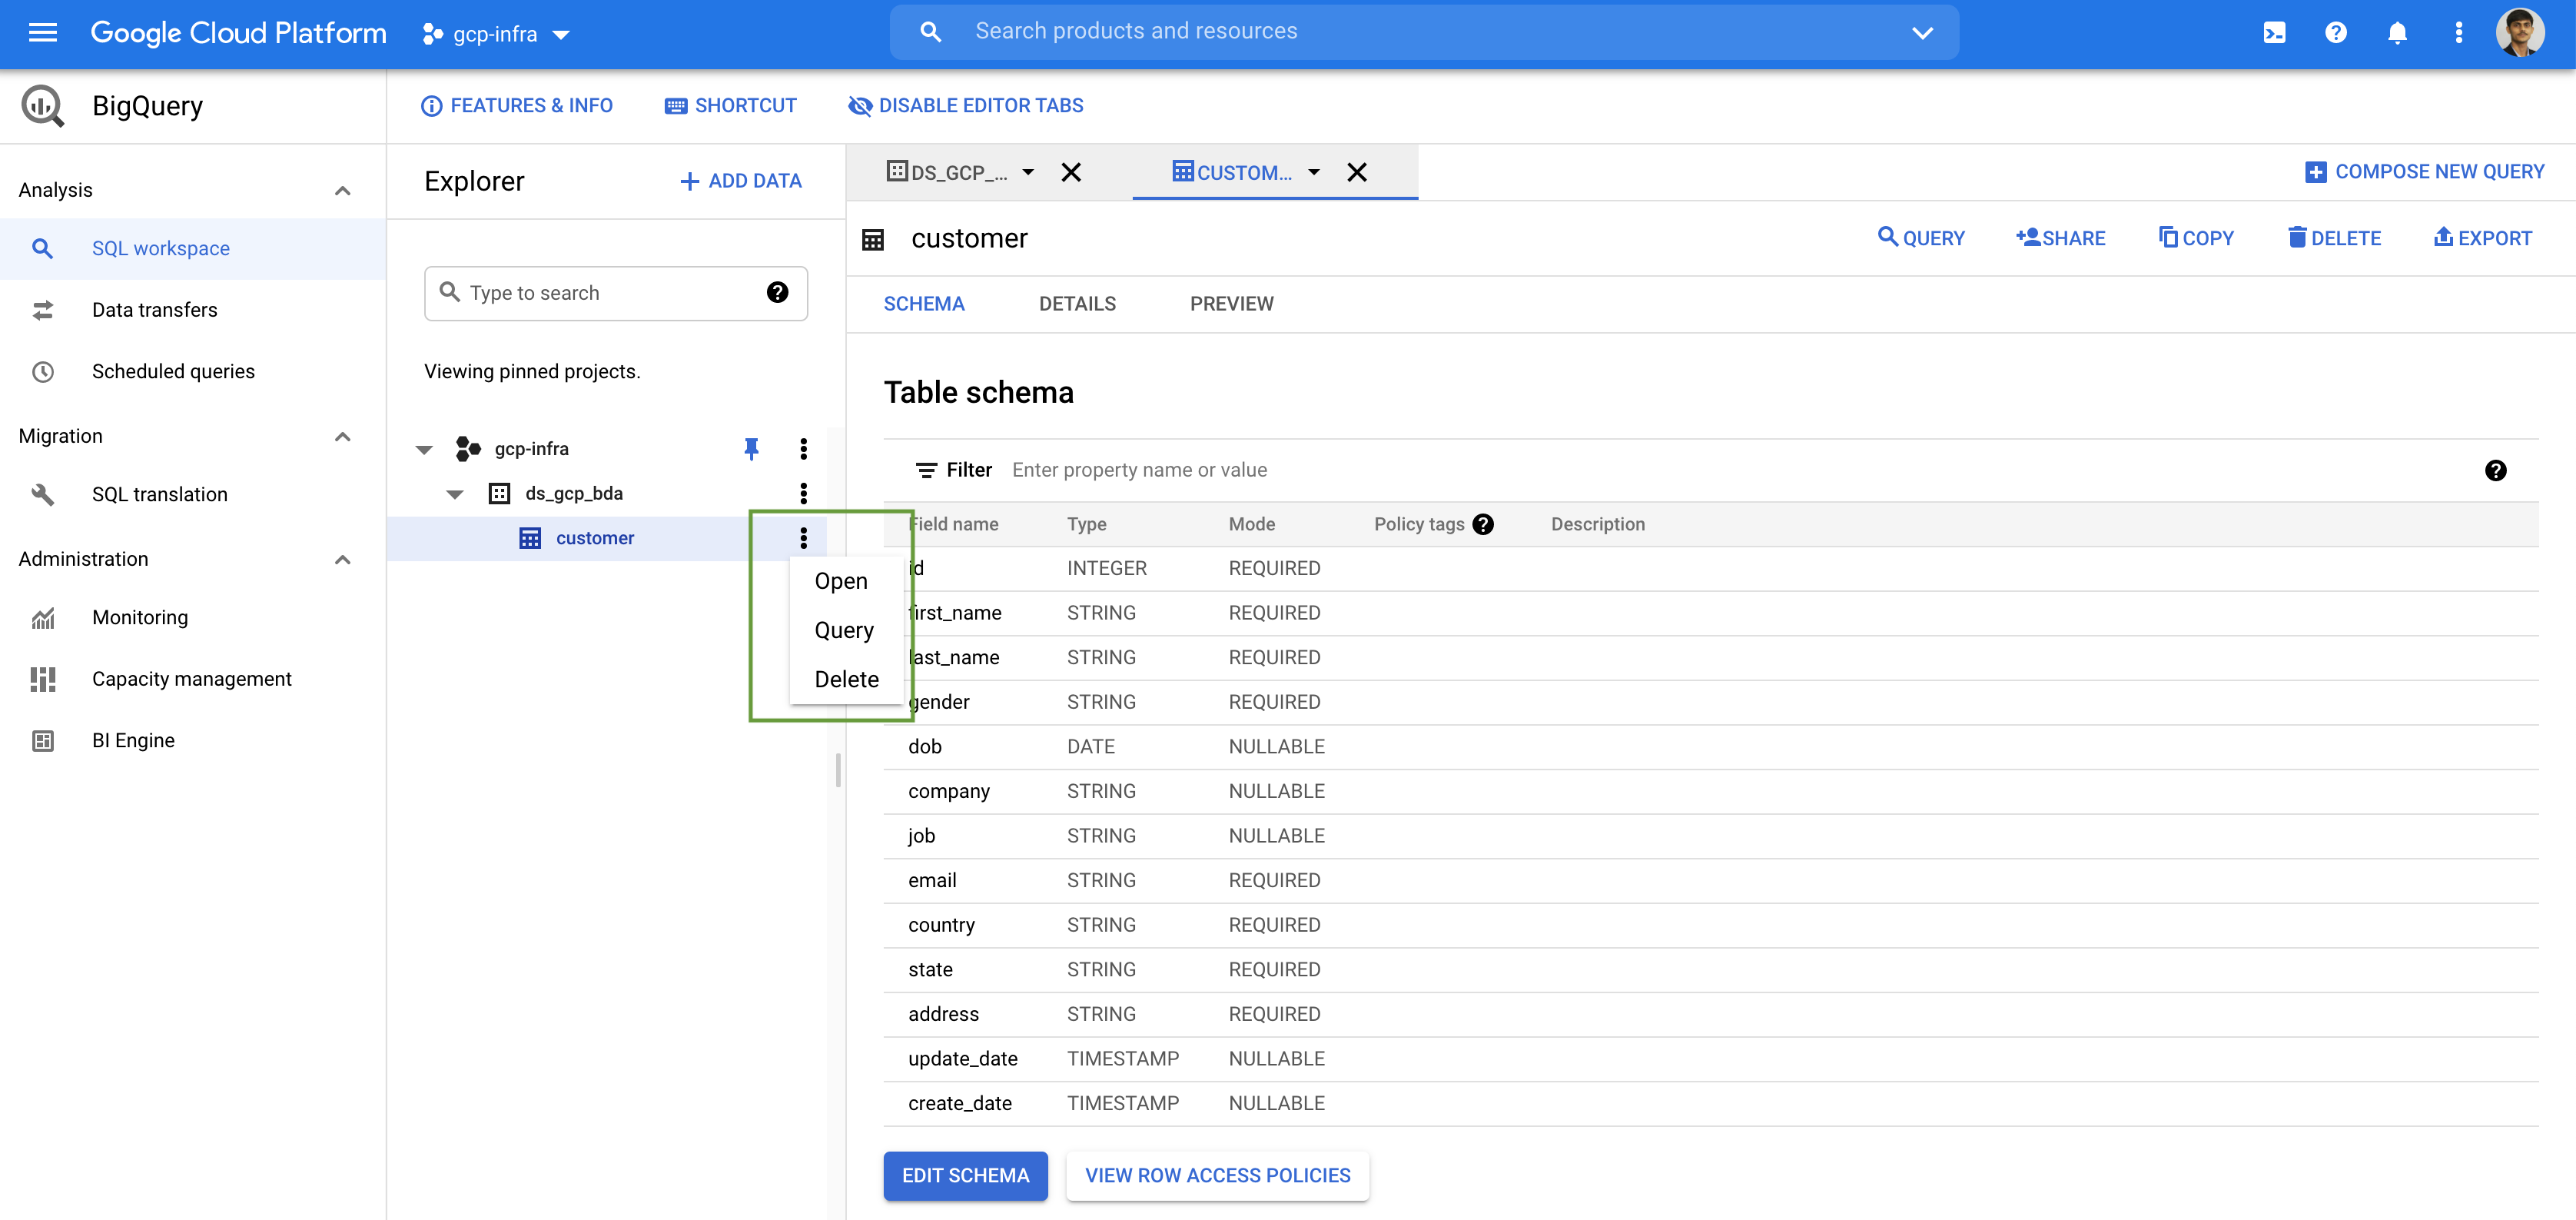
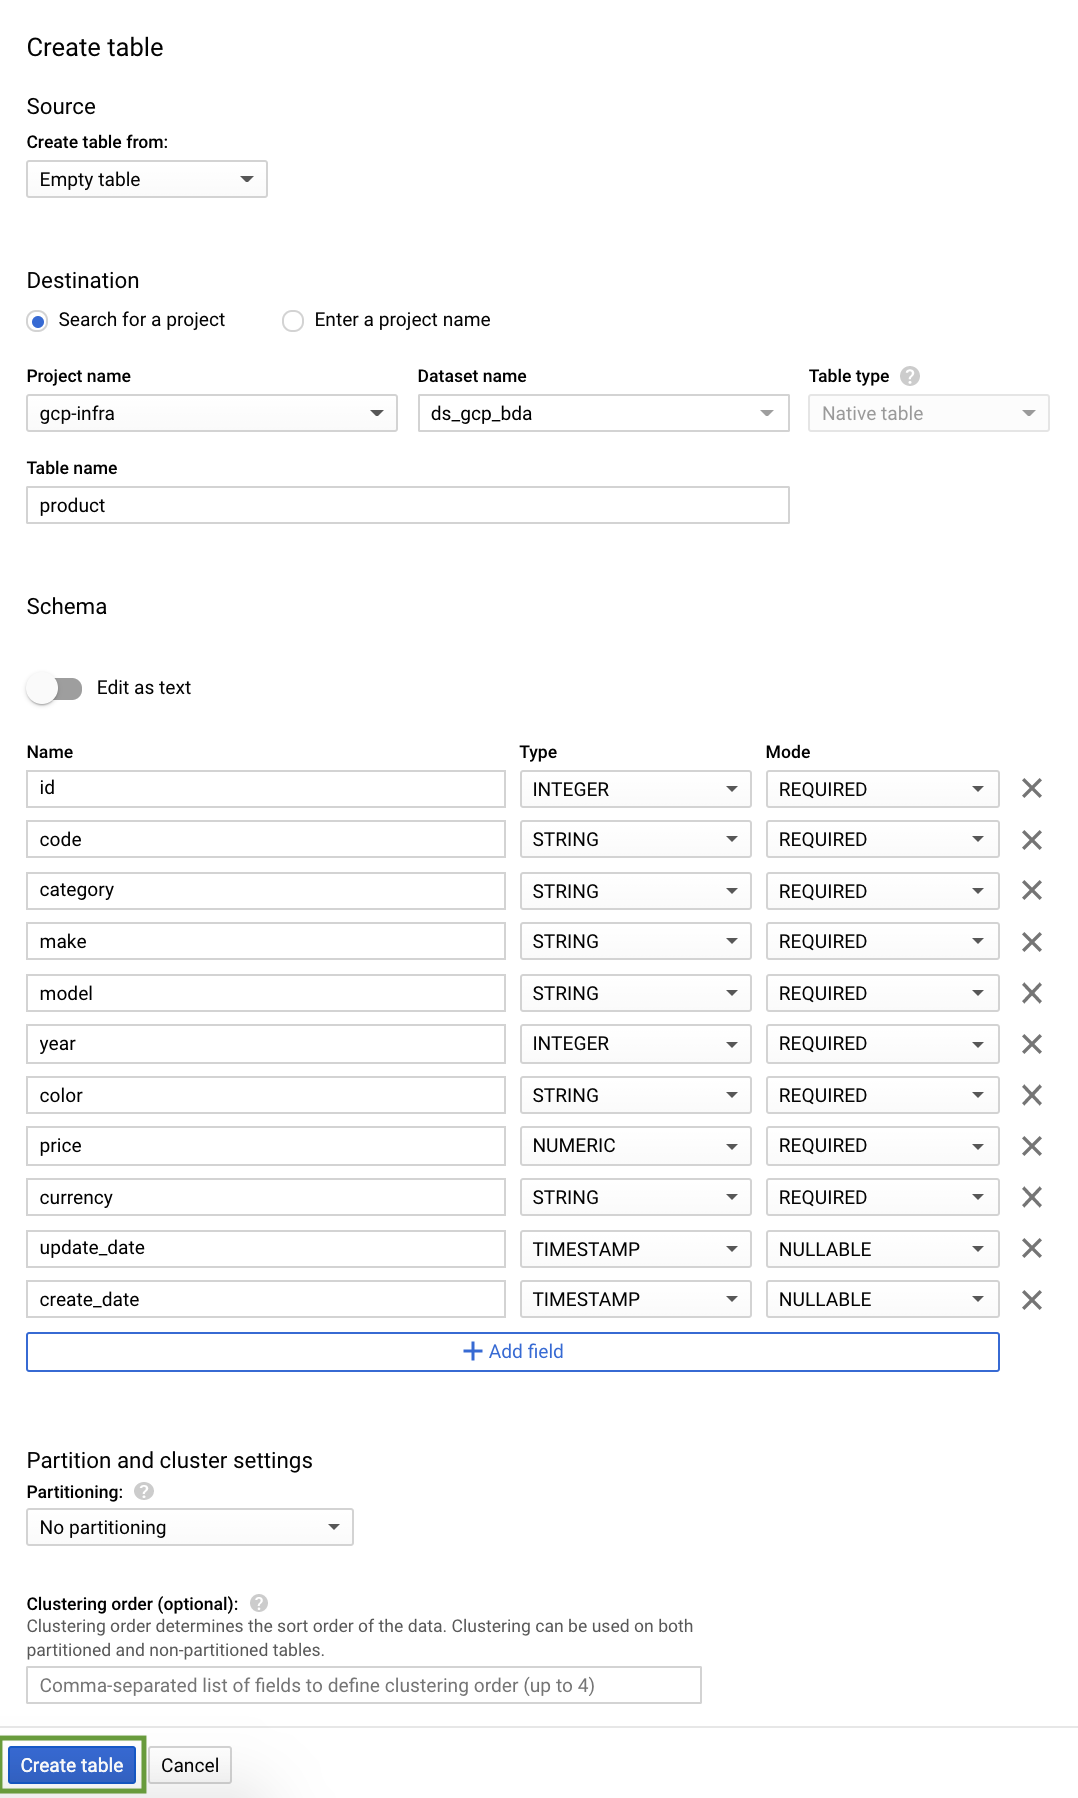
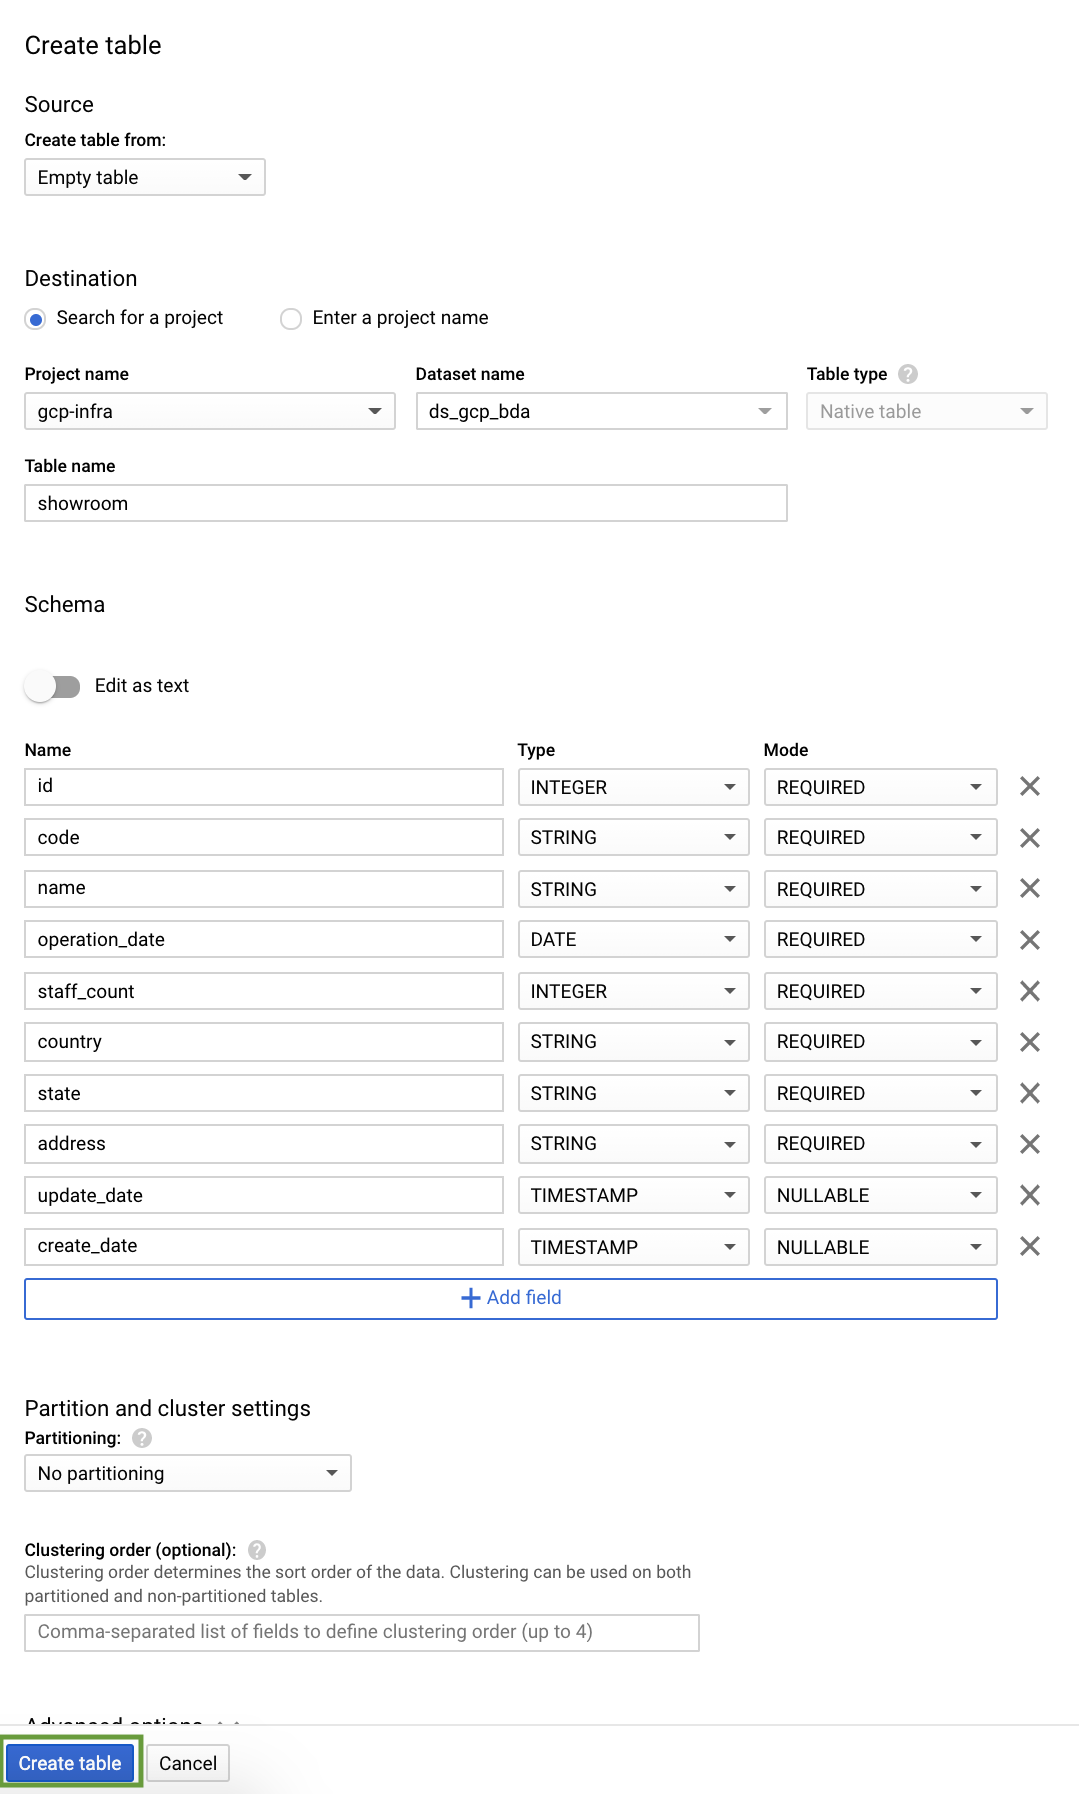
Every table is defined by a schema that describes the column names, data types, and other information.
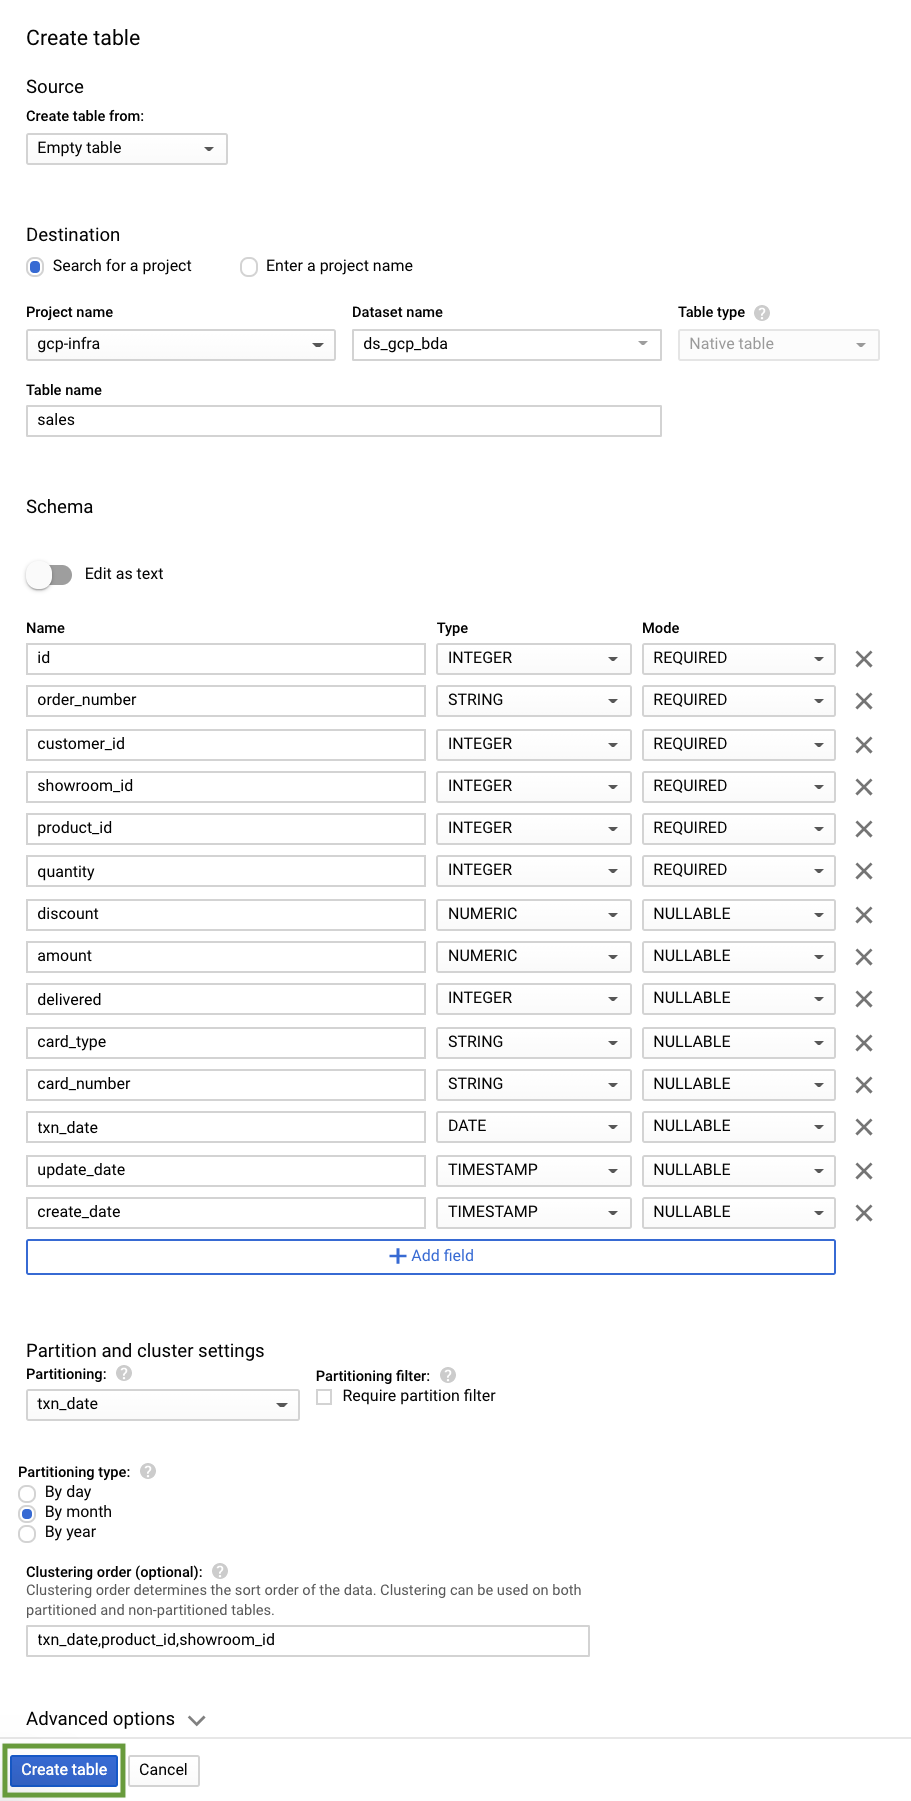
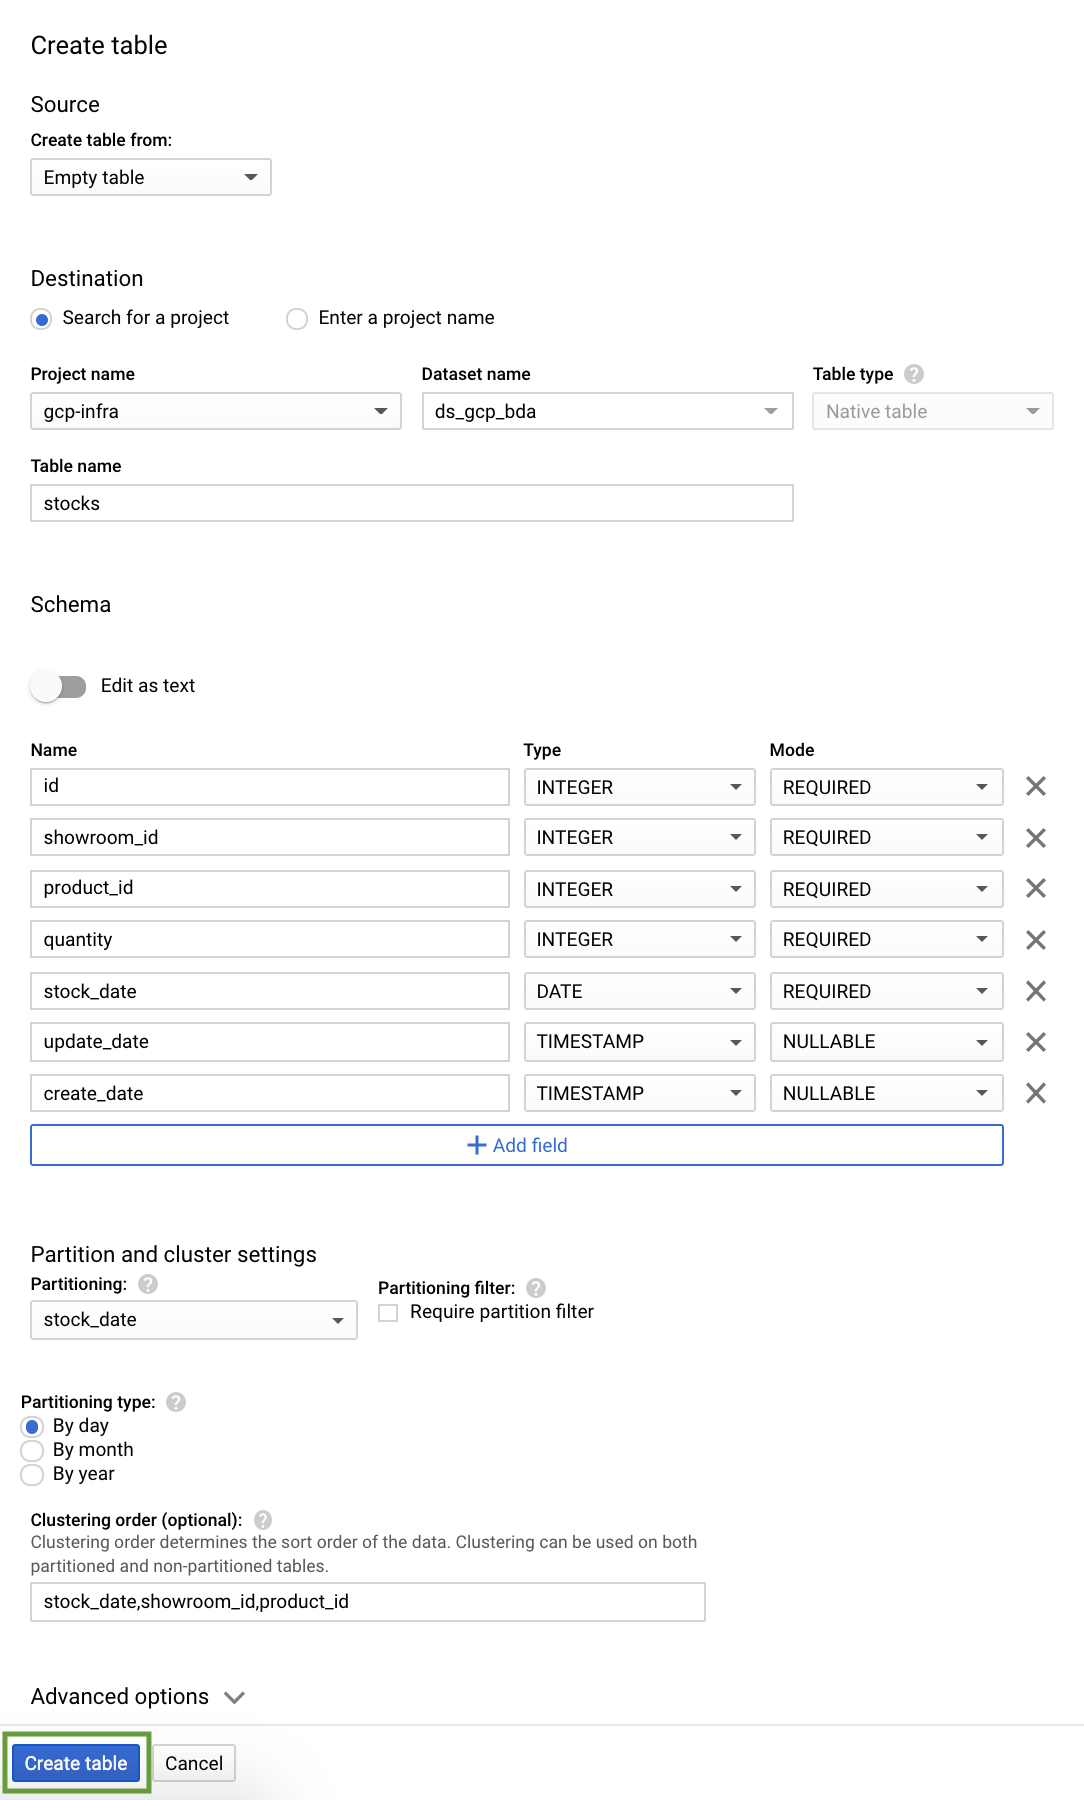
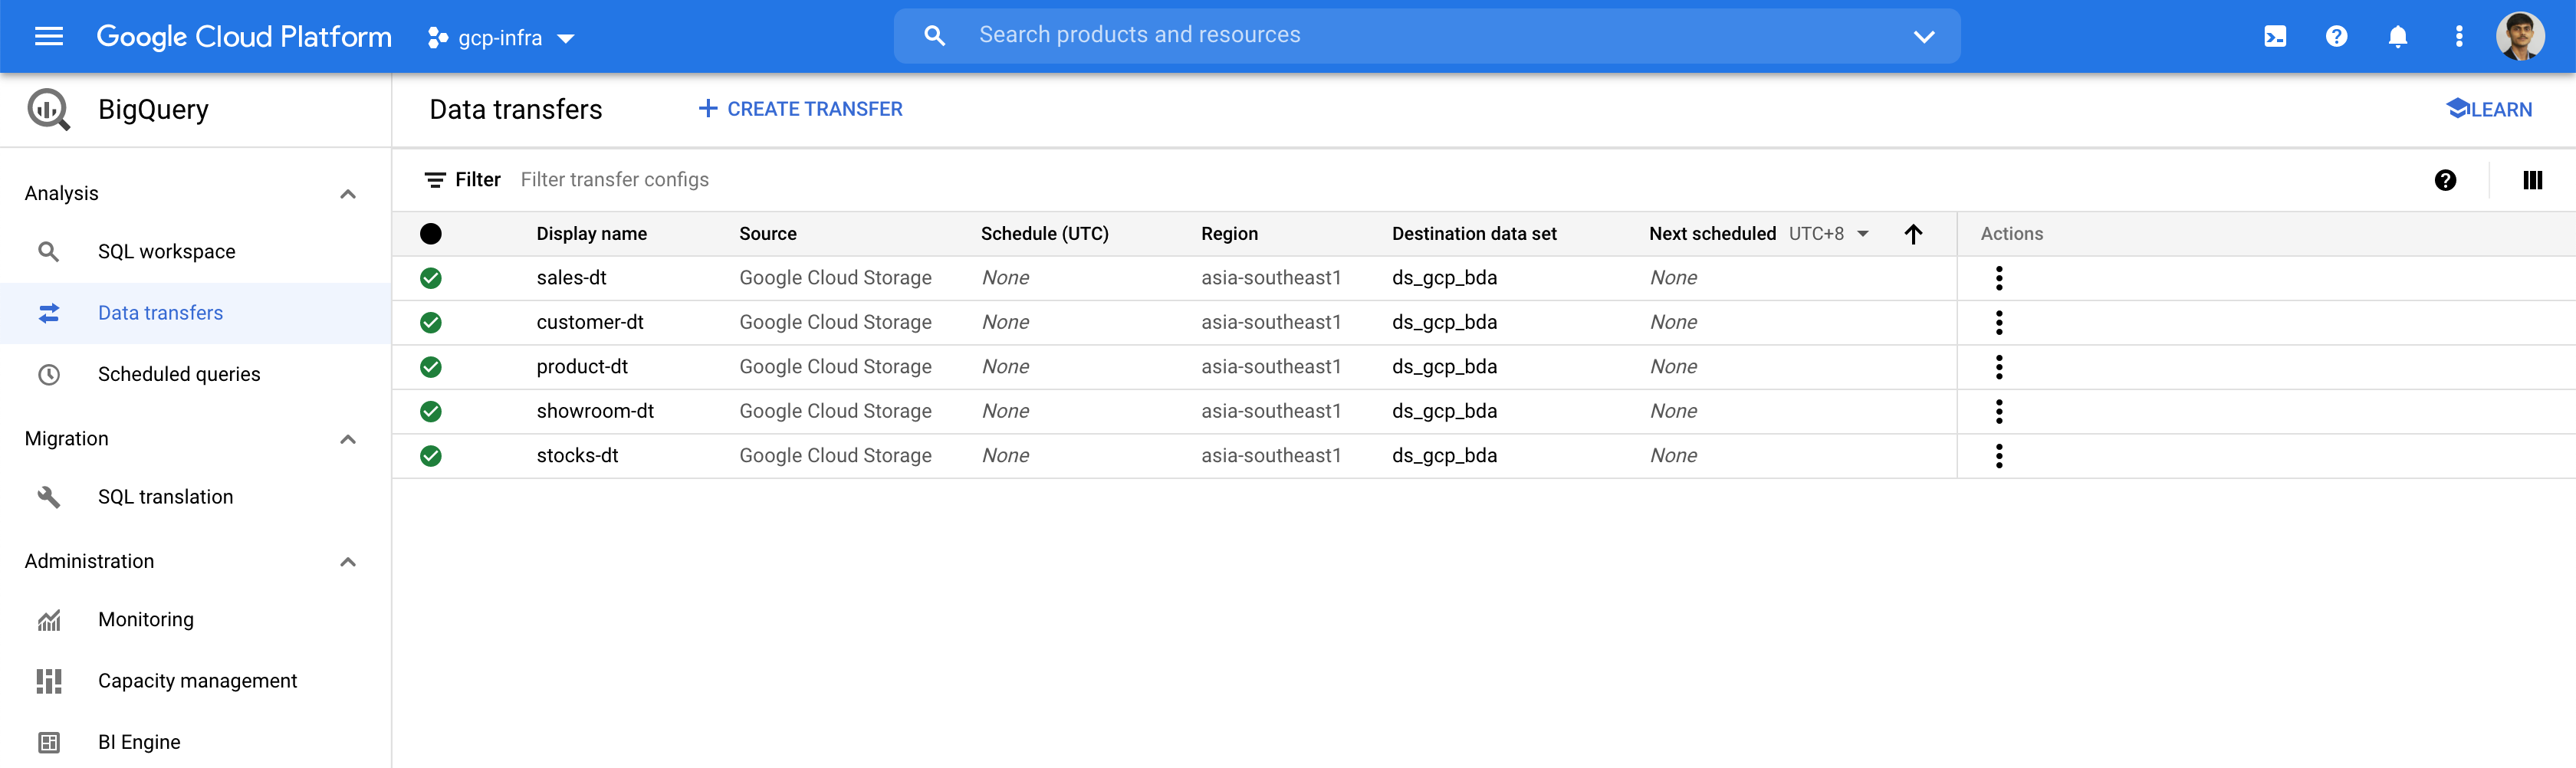
Let us create 5 tables for our car sales analytics- customer, product, showroom, sales & stocks.
Partitioned Table
A partitioned table is a special table that is divided into segments, called partitions, that make it easier to manage and query data. By dividing a large table into smaller partitions, we can improve query performance, and we can control costs by reducing the number of bytes read by a query.
BigQuery table supports 3 types of partition:
- Time-unit column: Tables are partitioned based on a
TIMESTAMP,DATE, orDATETIMEcolumn in the table. - Ingestion time: Tables are partitioned based on the timestamp when BigQuery ingests the data.
- Integer range: Tables are partitioned based on an integer column.
If a query filters on the value of the partitioning column, BigQuery can scan the partitions that match the filter and skip the remaining partitions. This process is called pruning.
Clustered Table
In a BigQuery clustered table, the table data is automatically organized based on the contents of one or more columns in the table’s schema. The columns we specify are used to colocate related data. When we cluster a table using multiple columns, the order of columns we specify is important. The order of the specified columns determines the sort order of the data.
Clustering can improve the performance of certain types of queries such as queries that use filter clauses and queries that aggregate data. When we submit a query that contains a clause that filters data based on the clustering columns, BigQuery uses the sorted blocks to eliminate scans of unnecessary data.
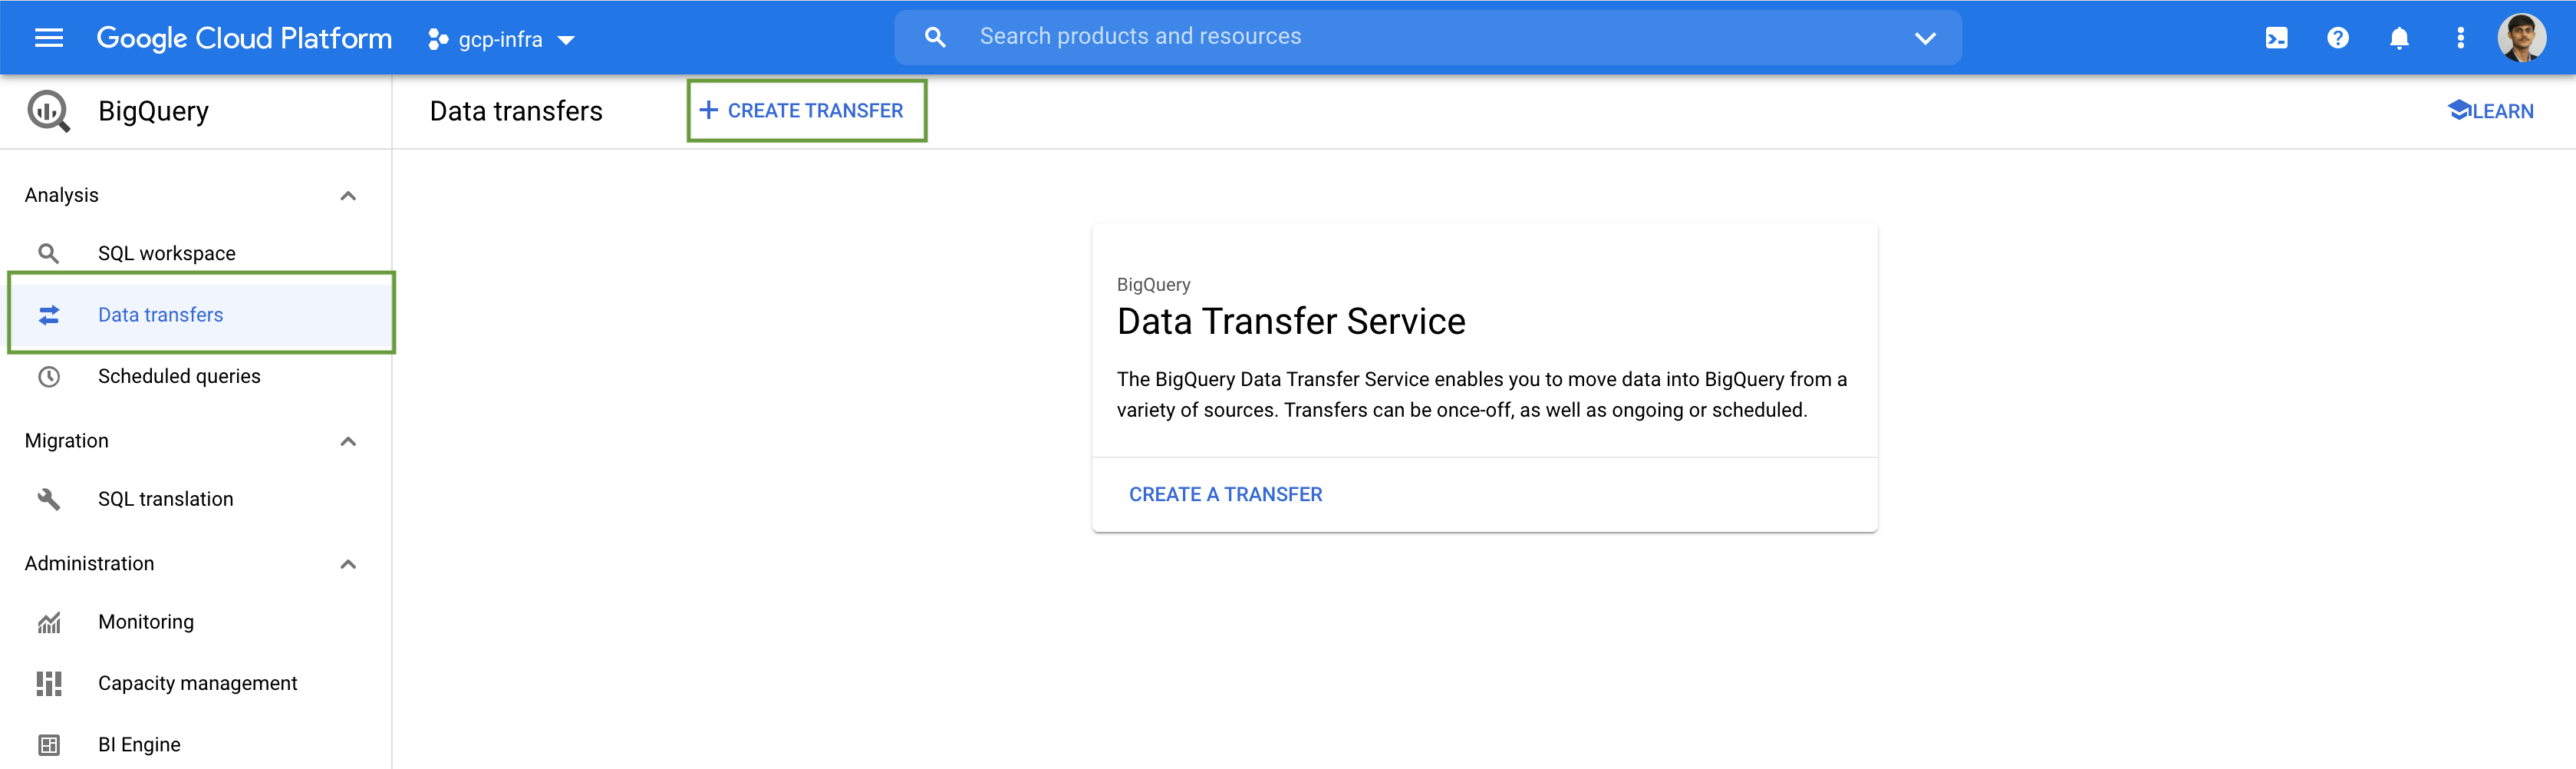
Jobs are actions that BigQuery runs on our behalf to load data, export data, query data, or copy data. Connections and jobs are are associated with a project rather than dataset.
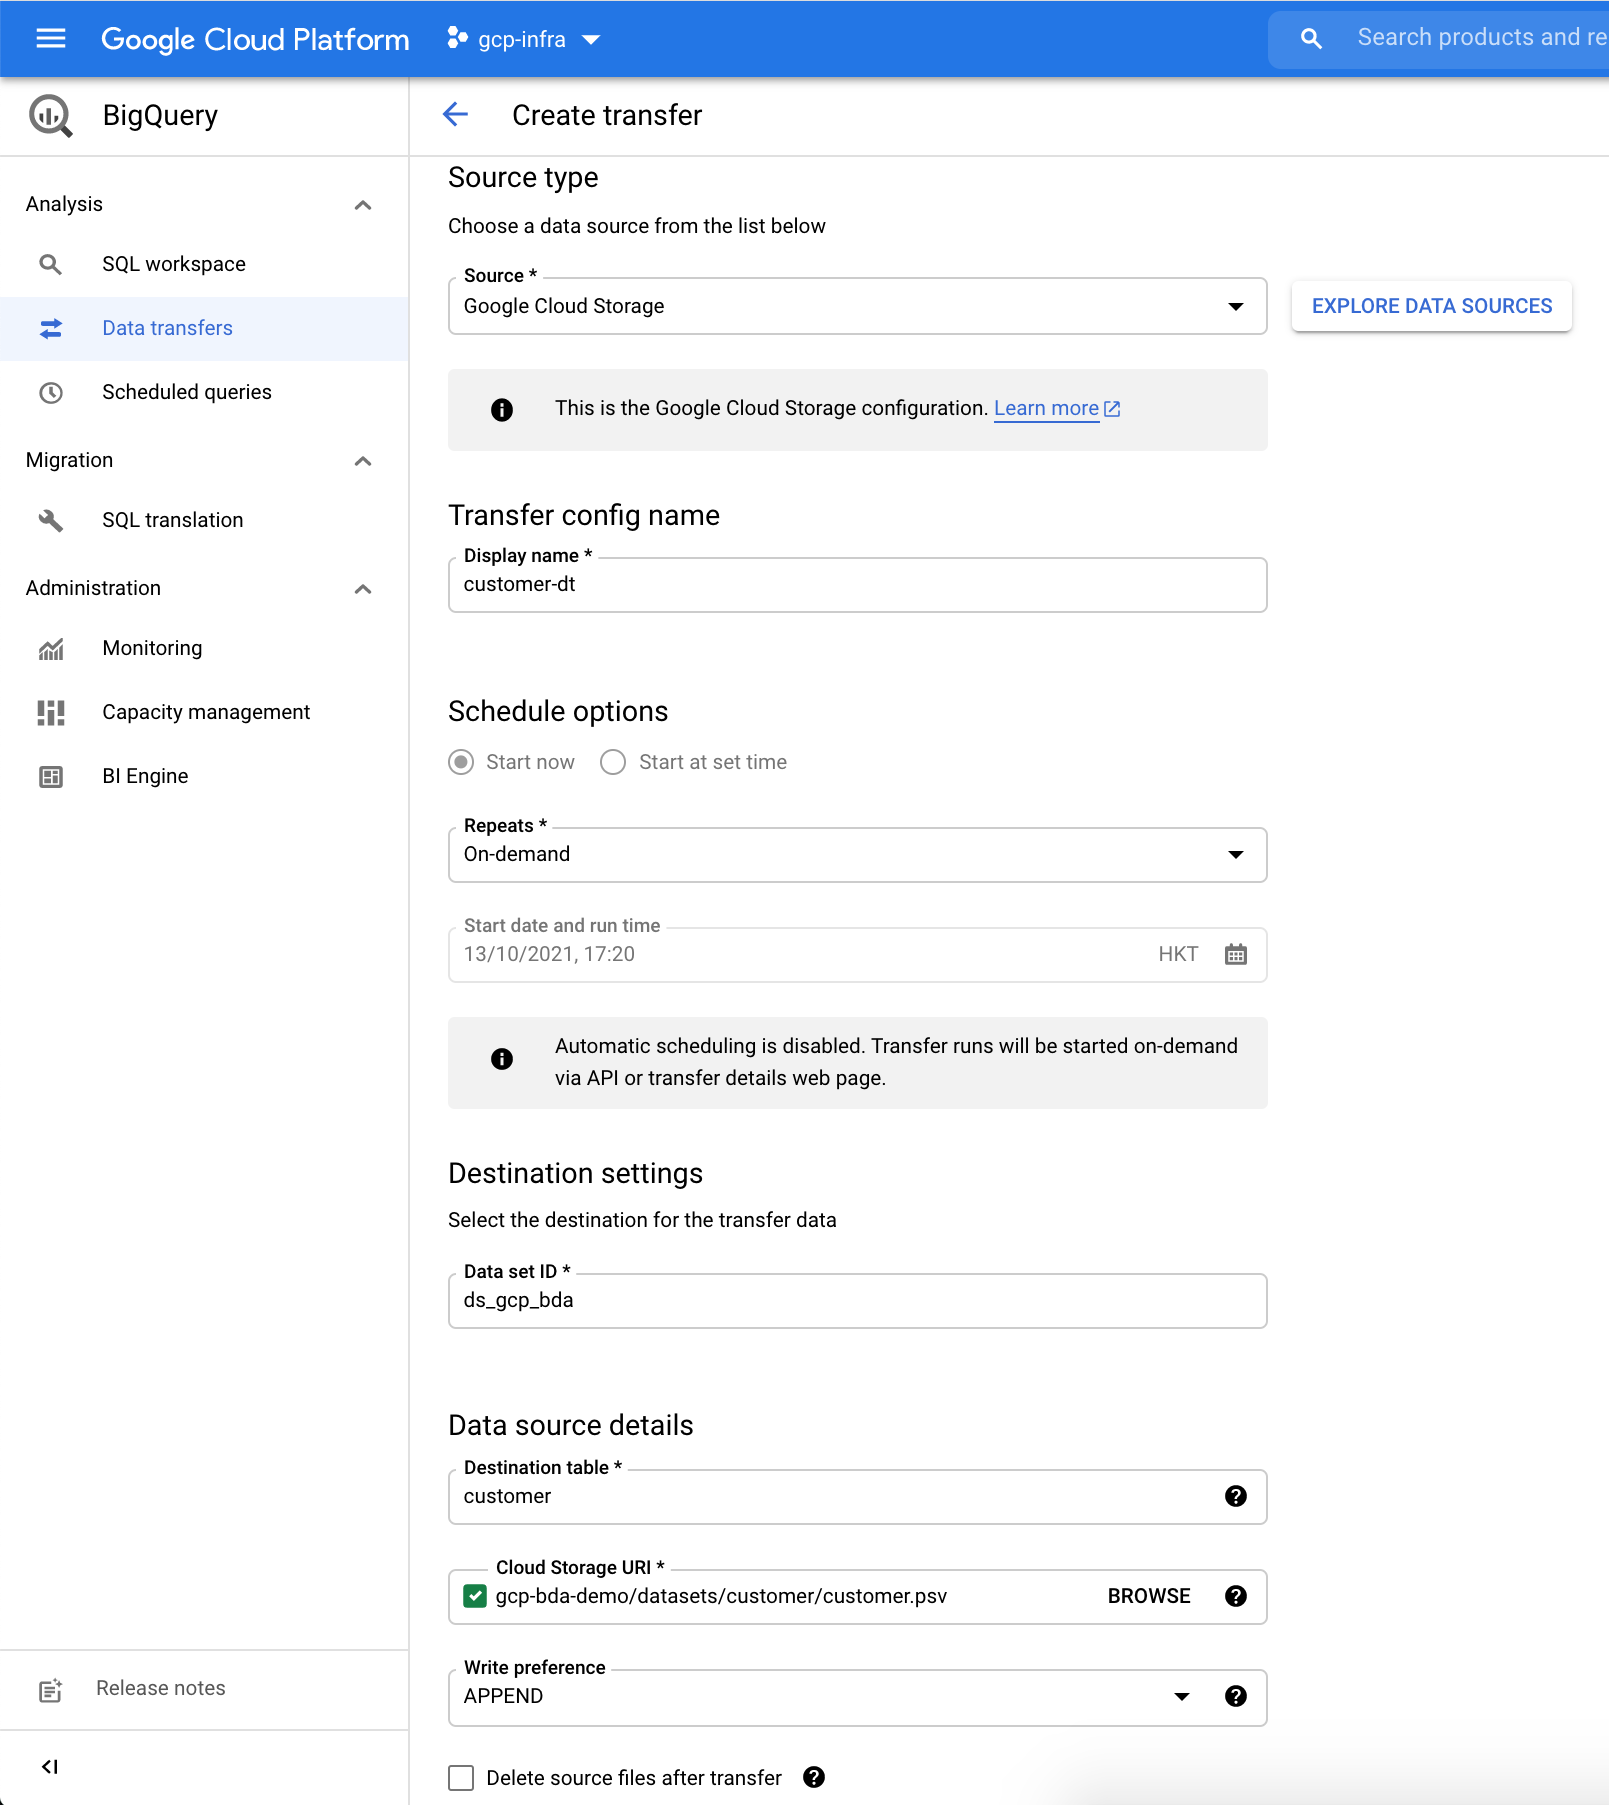
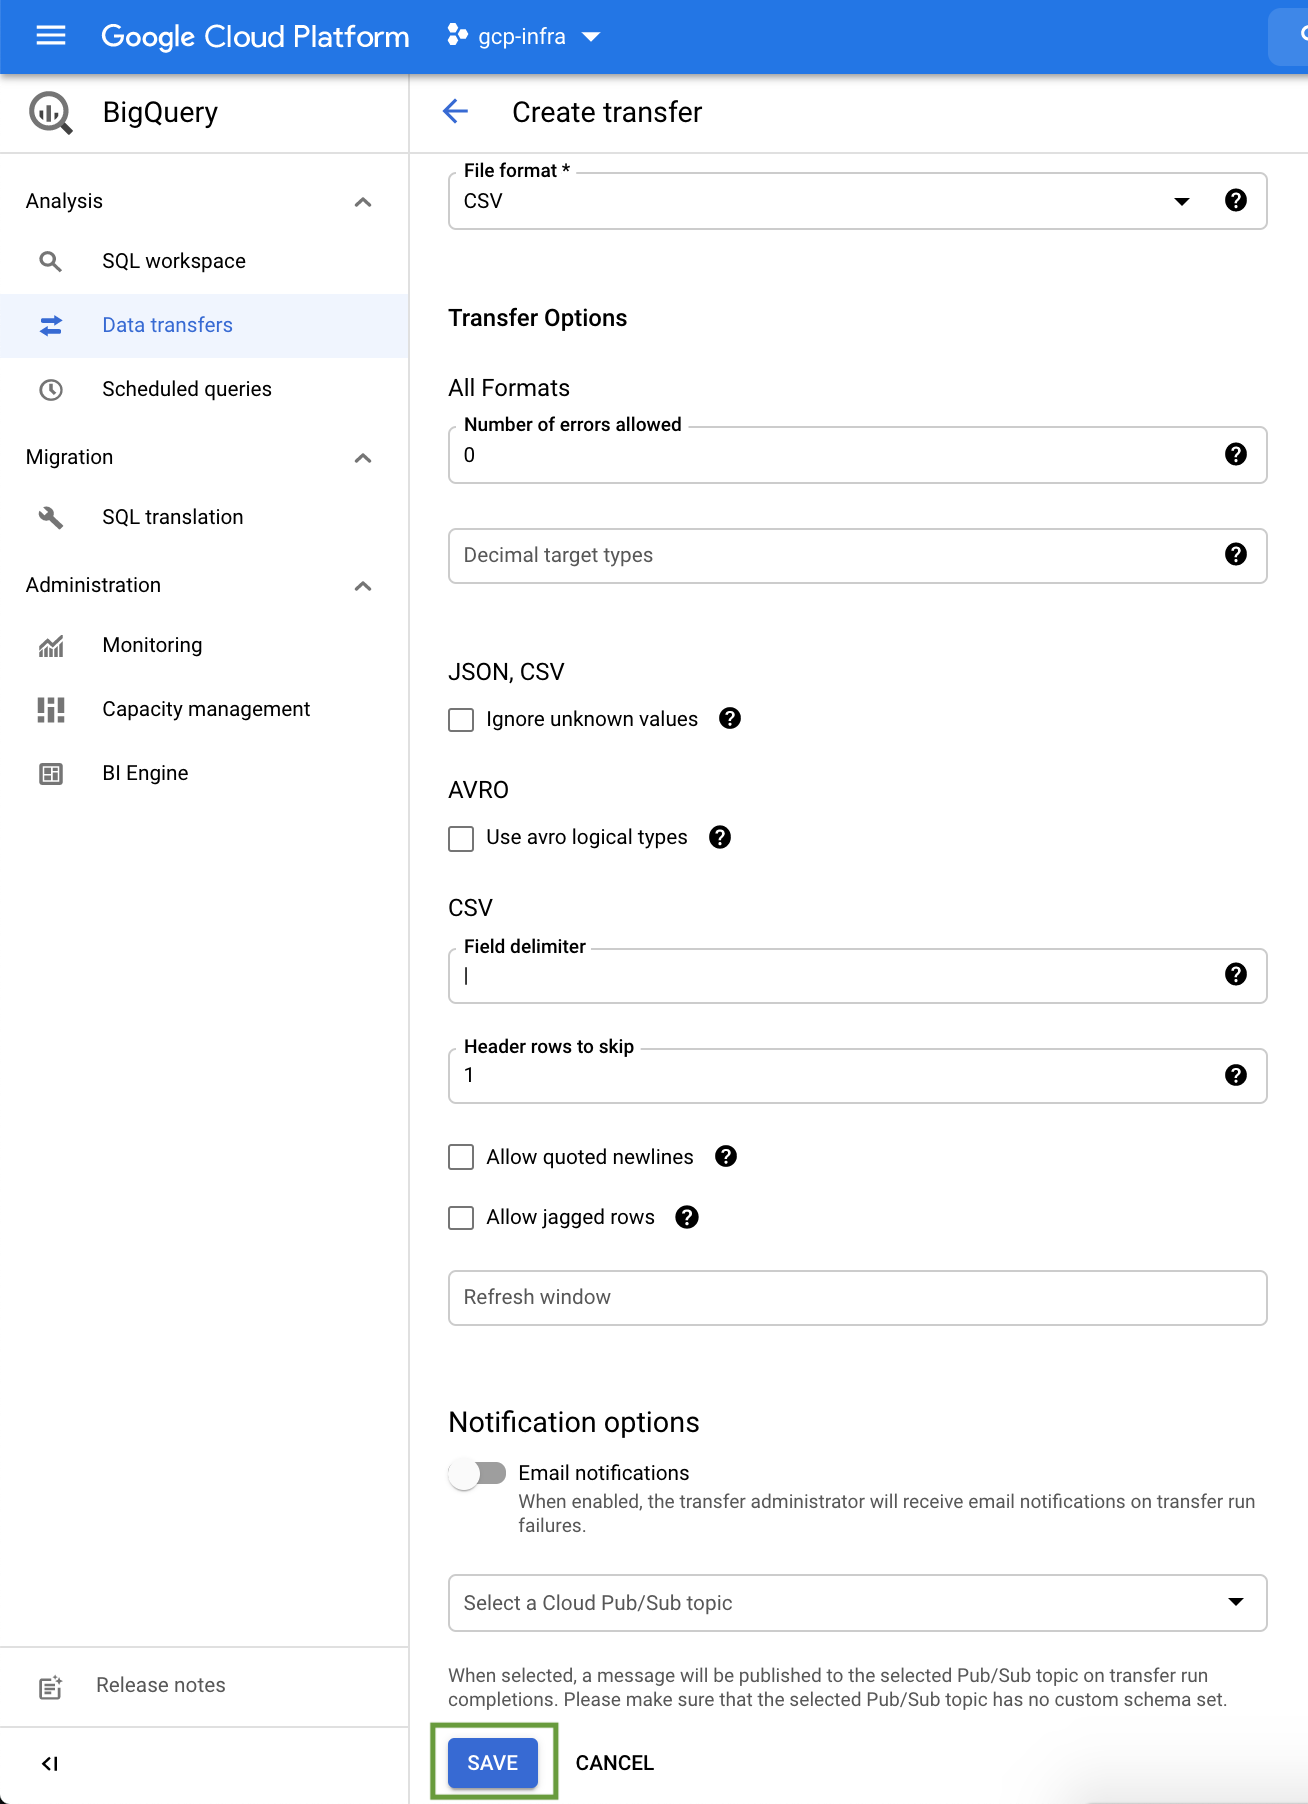
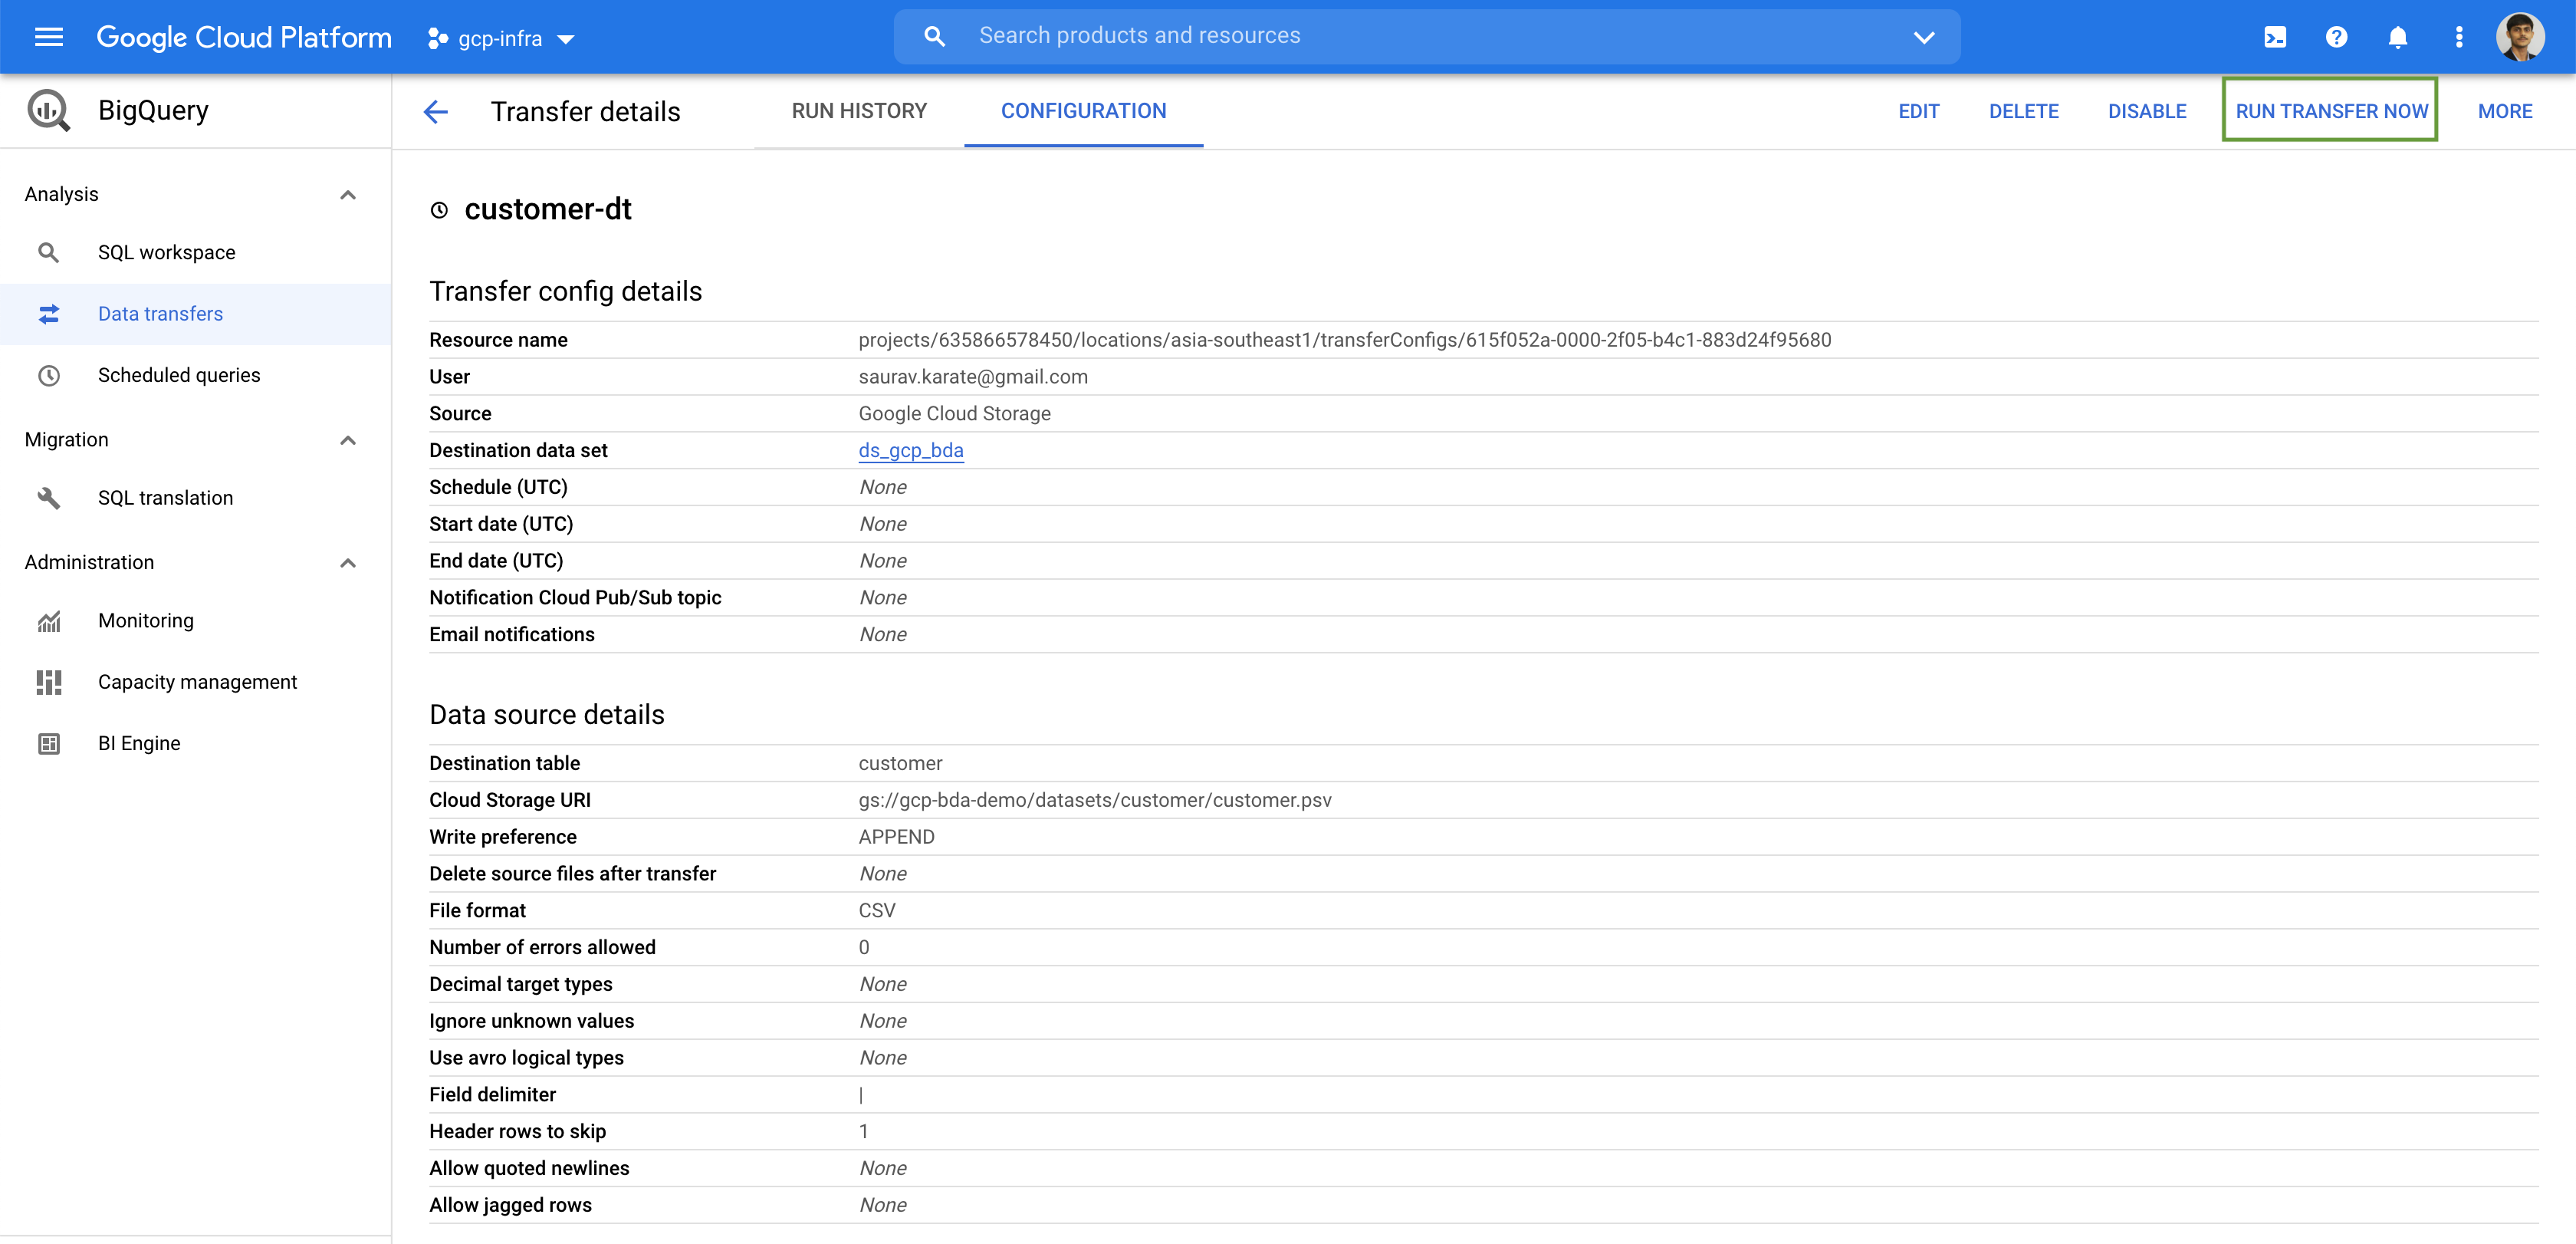
The BigQuery Data Transfer Service automates data movement into BigQuery on a scheduled, managed basis. The BigQuery Data Transfer Service for Cloud Storage allows you to schedule recurring data loads from Cloud Storage to BigQuery. In addition to automatically scheduled transfers from Cloud Storage, you can manually trigger a transfer to load additional data files.
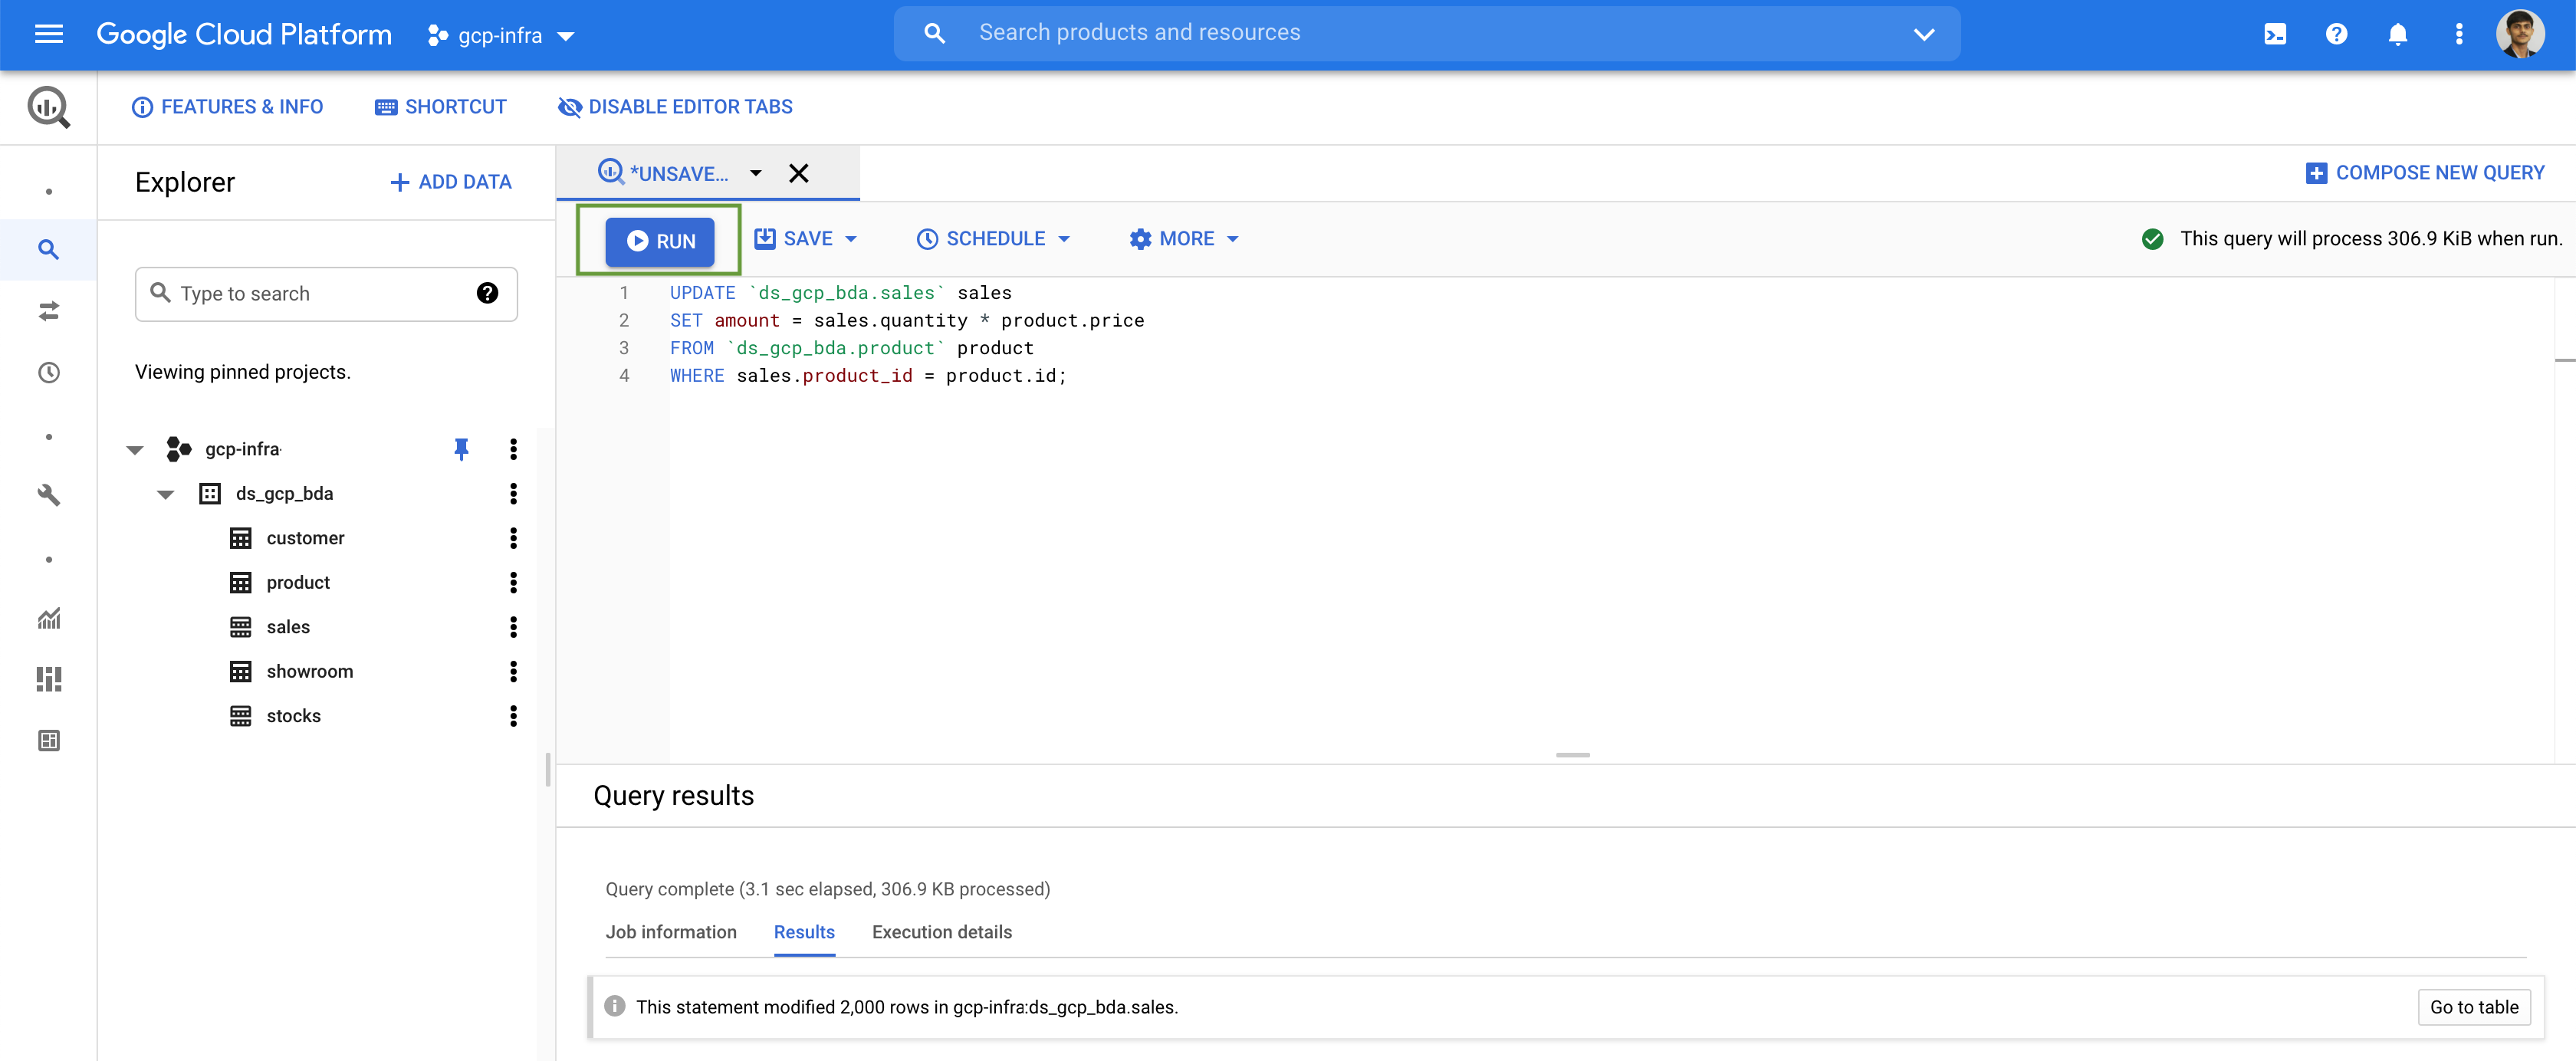
UPDATE `ds_gcp_bda.sales` sales
SET amount = sales.quantity * product.price
FROM `ds_gcp_bda.product` product
WHERE sales.product_id = product.id;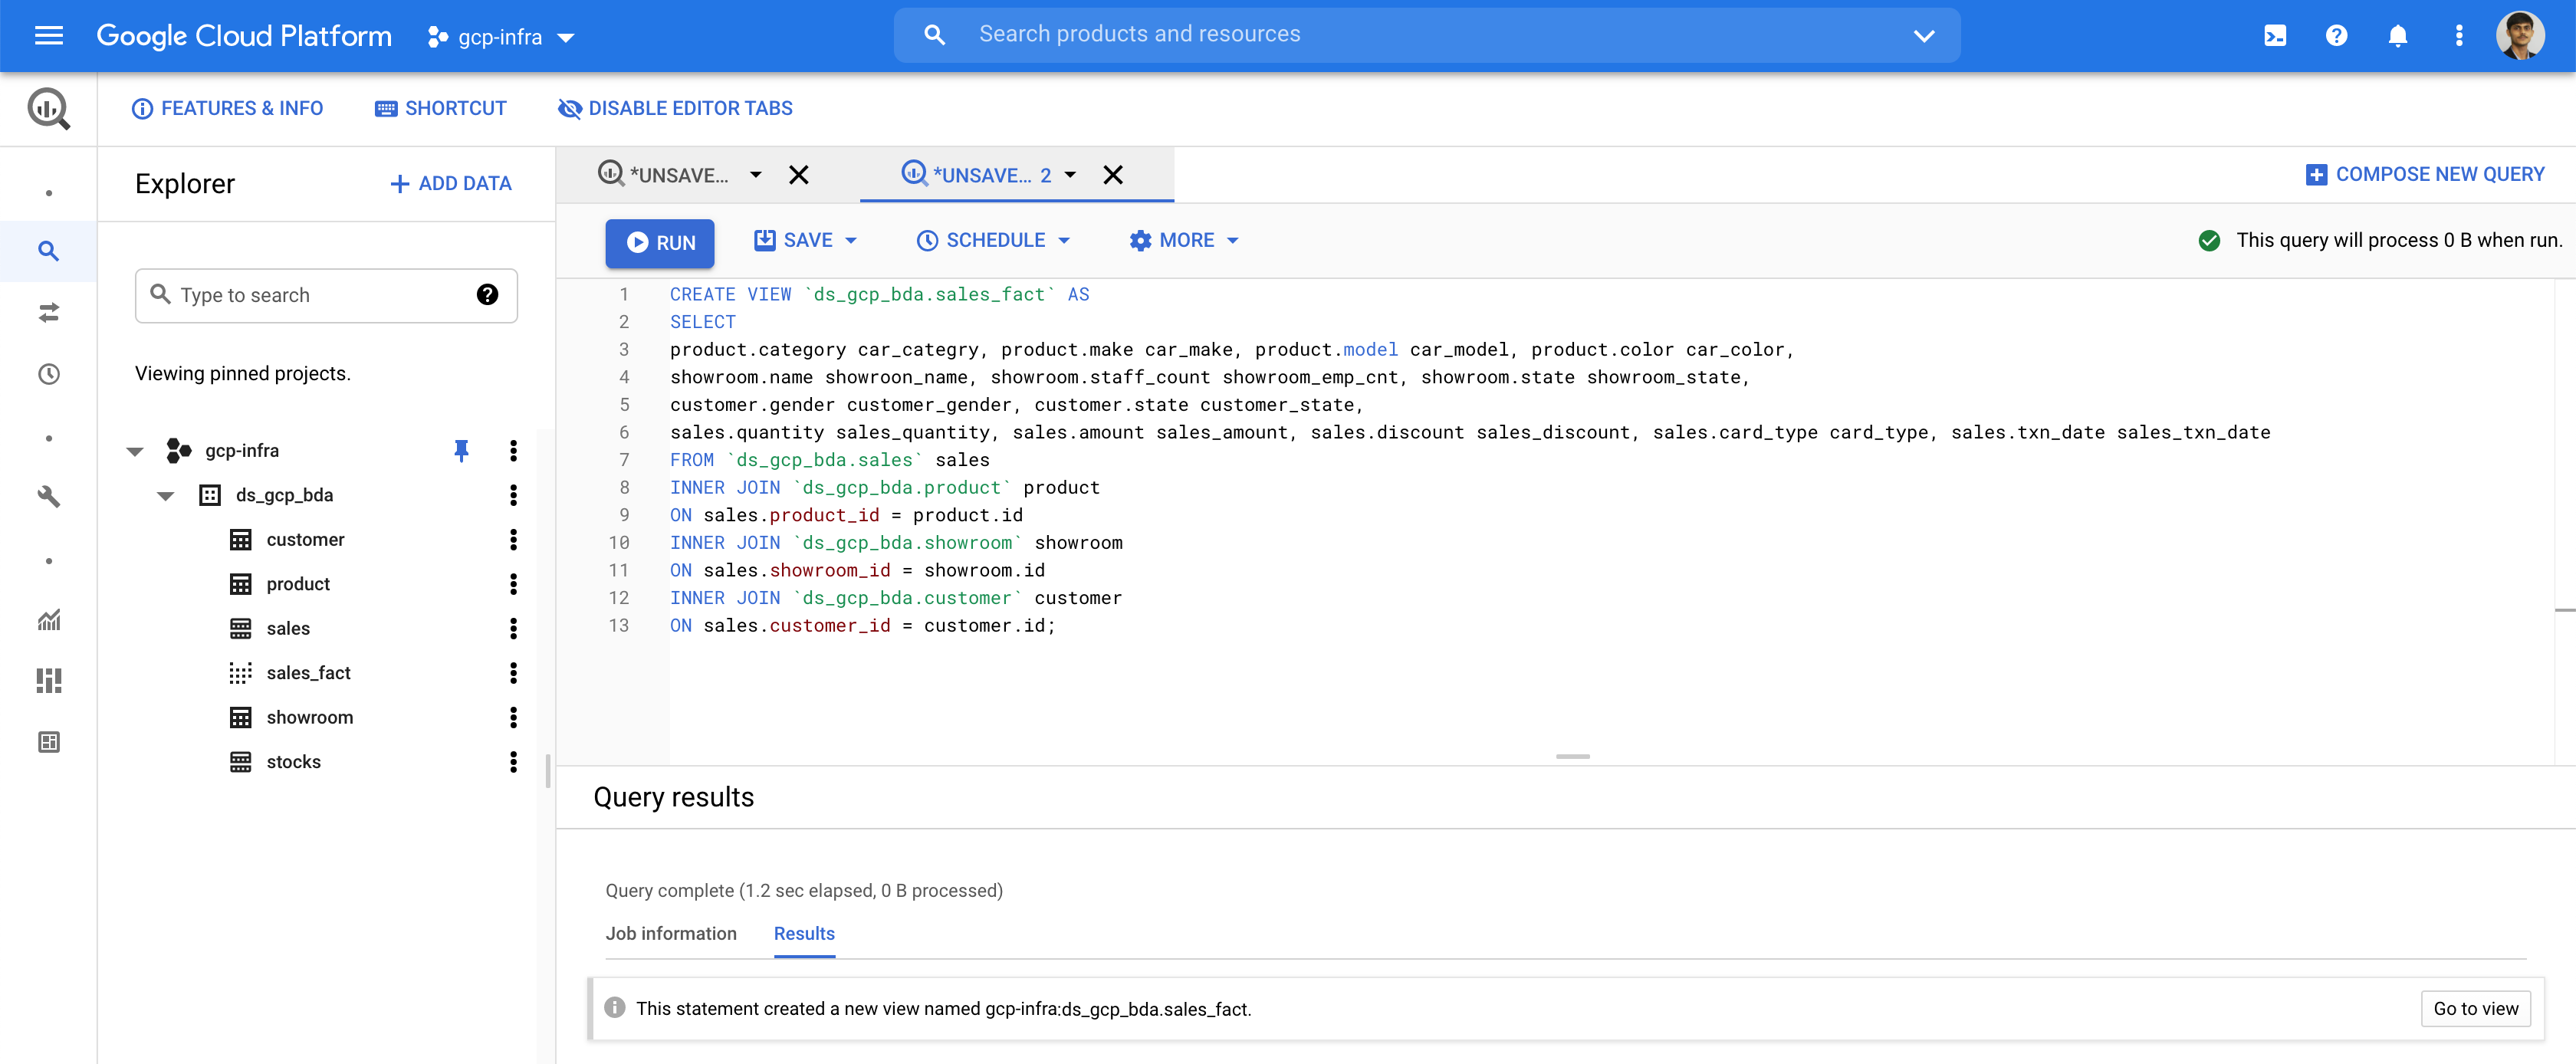
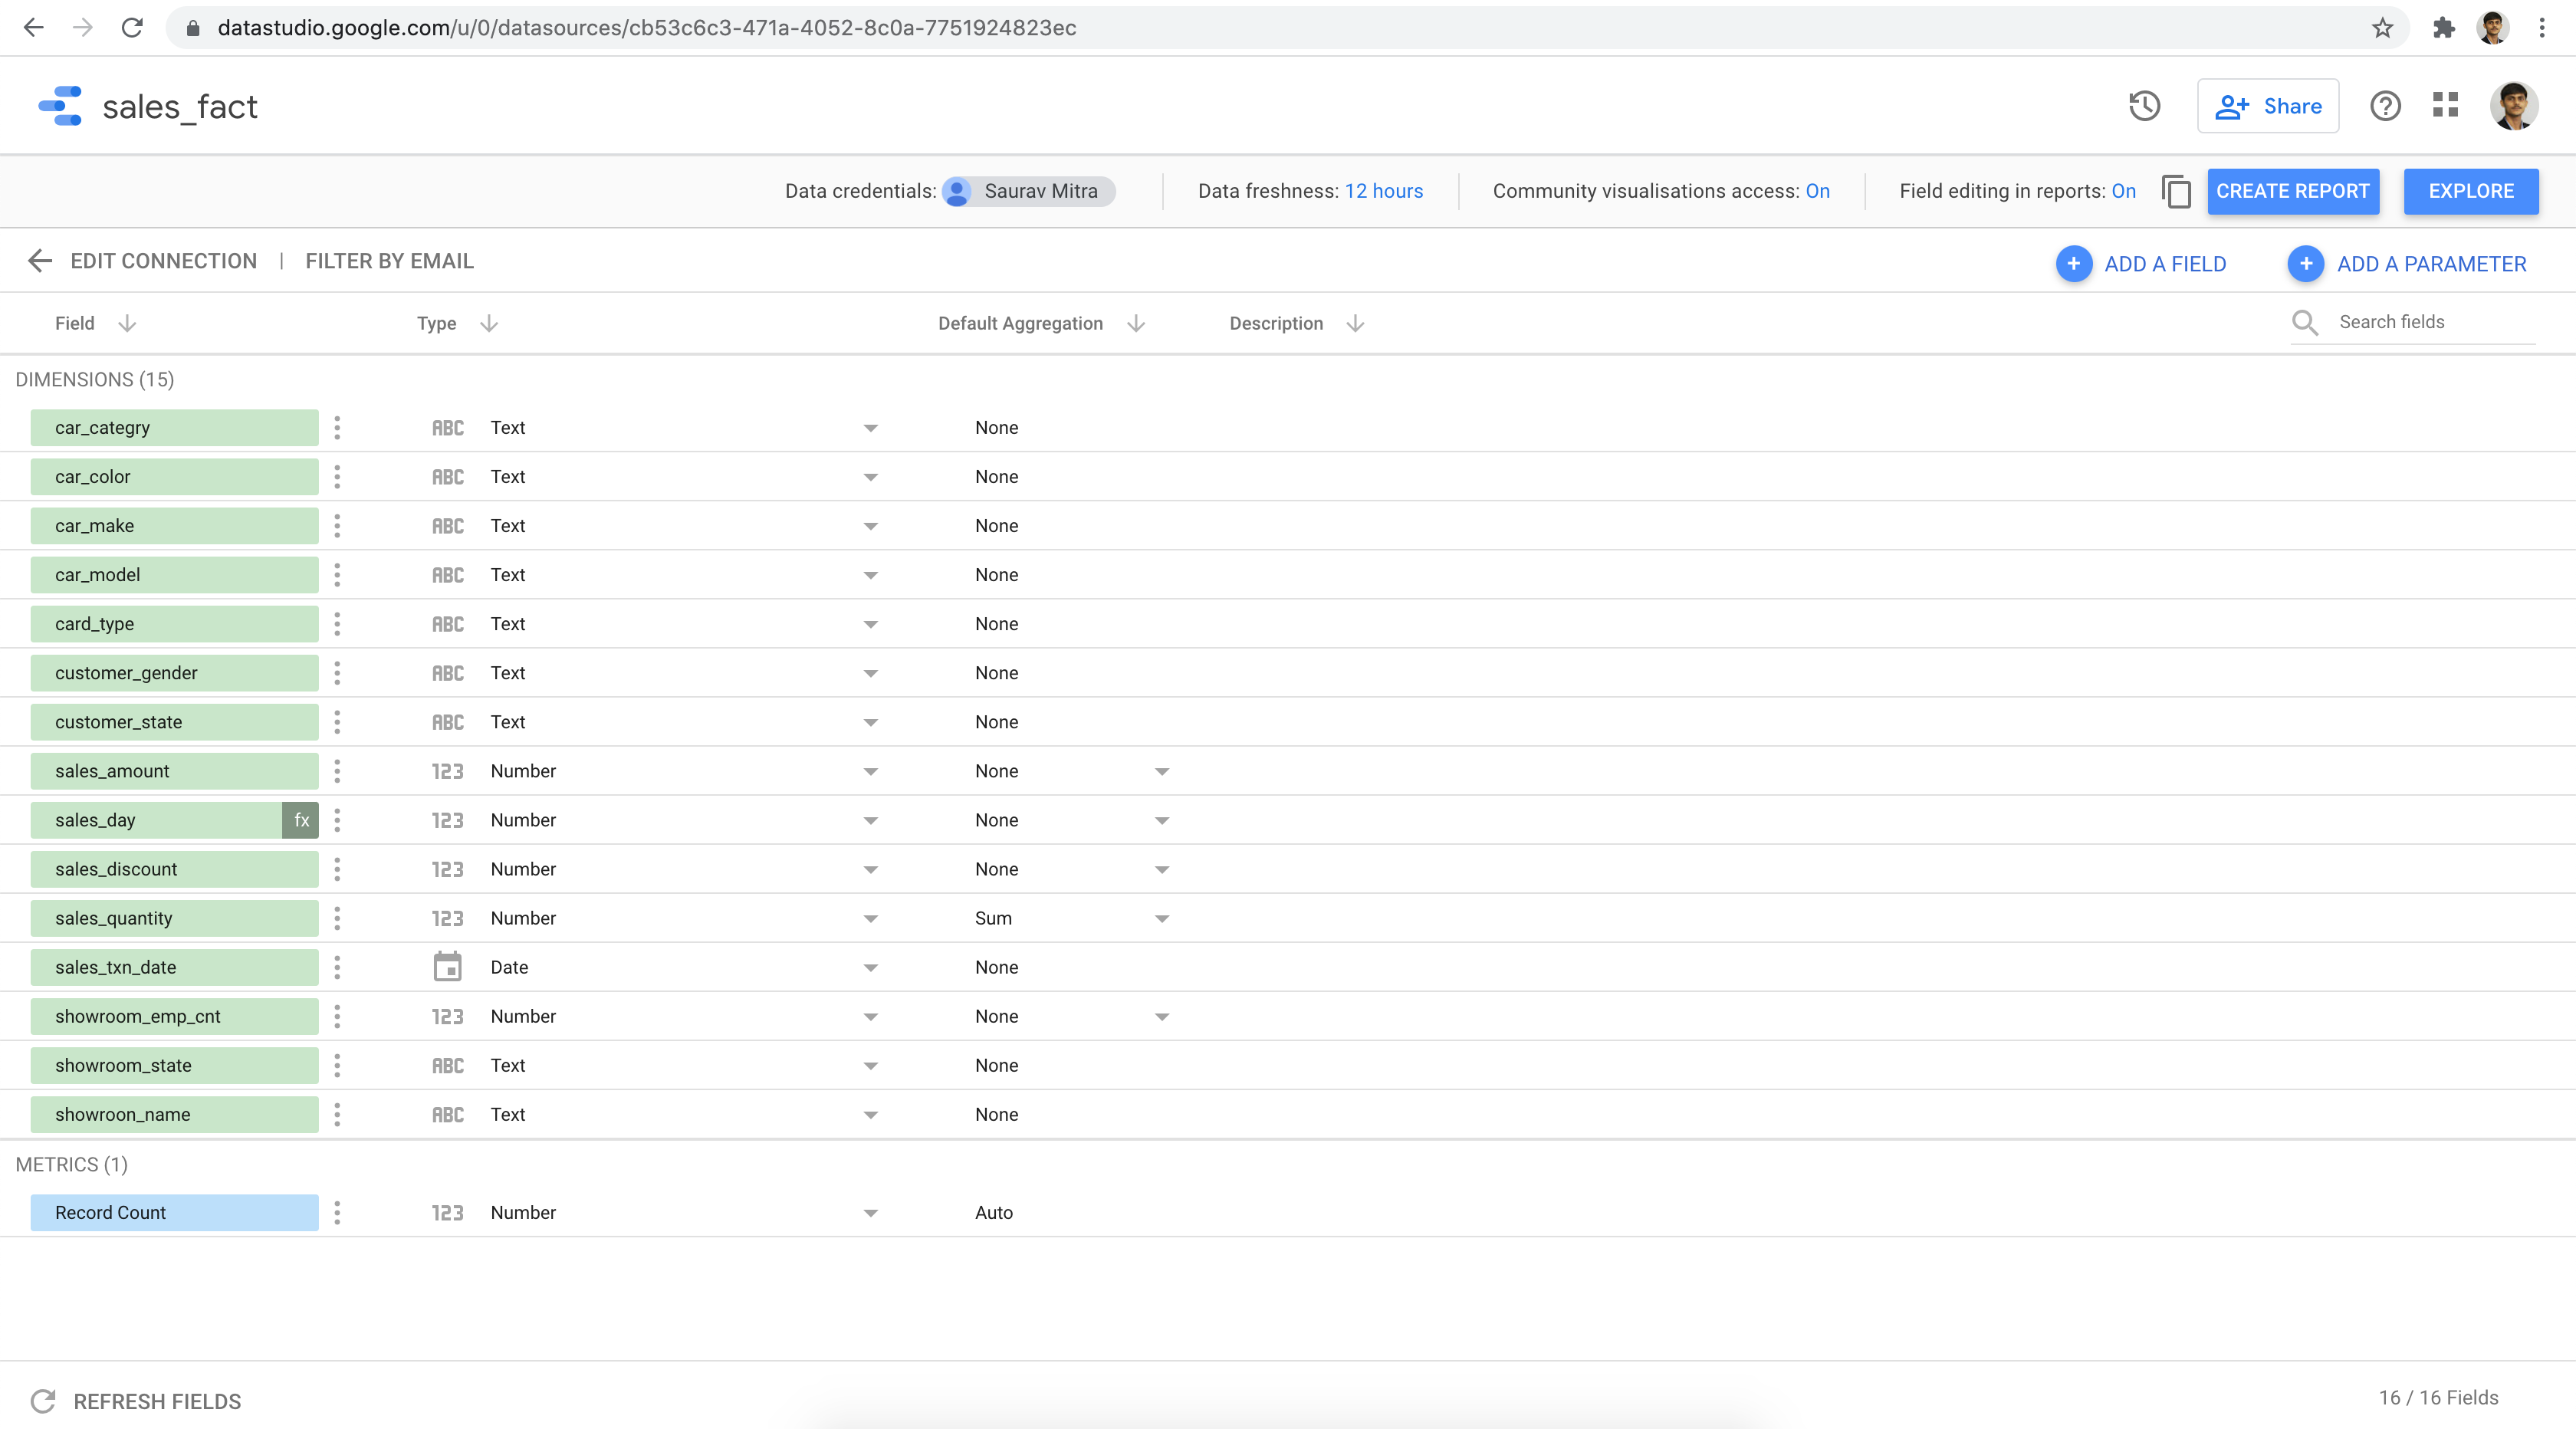
CREATE VIEW `ds_gcp_bda.sales_fact` AS
SELECT
product.category car_categry, product.make car_make, product.model car_model, product.color car_color,
showroom.name showroon_name, showroom.staff_count showroom_emp_cnt, showroom.state showroom_state,
customer.gender customer_gender, customer.state customer_state,
sales.quantity sales_quantity, sales.amount sales_amount, sales.discount sales_discount, sales.card_type card_type, sales.txn_date sales_txn_date
FROM `ds_gcp_bda.sales` sales
INNER JOIN `ds_gcp_bda.product` product
ON sales.product_id = product.id
INNER JOIN `ds_gcp_bda.showroom` showroom
ON sales.showroom_id = showroom.id
INNER JOIN `ds_gcp_bda.customer` customer
ON sales.customer_id = customer.id;
Data Studio
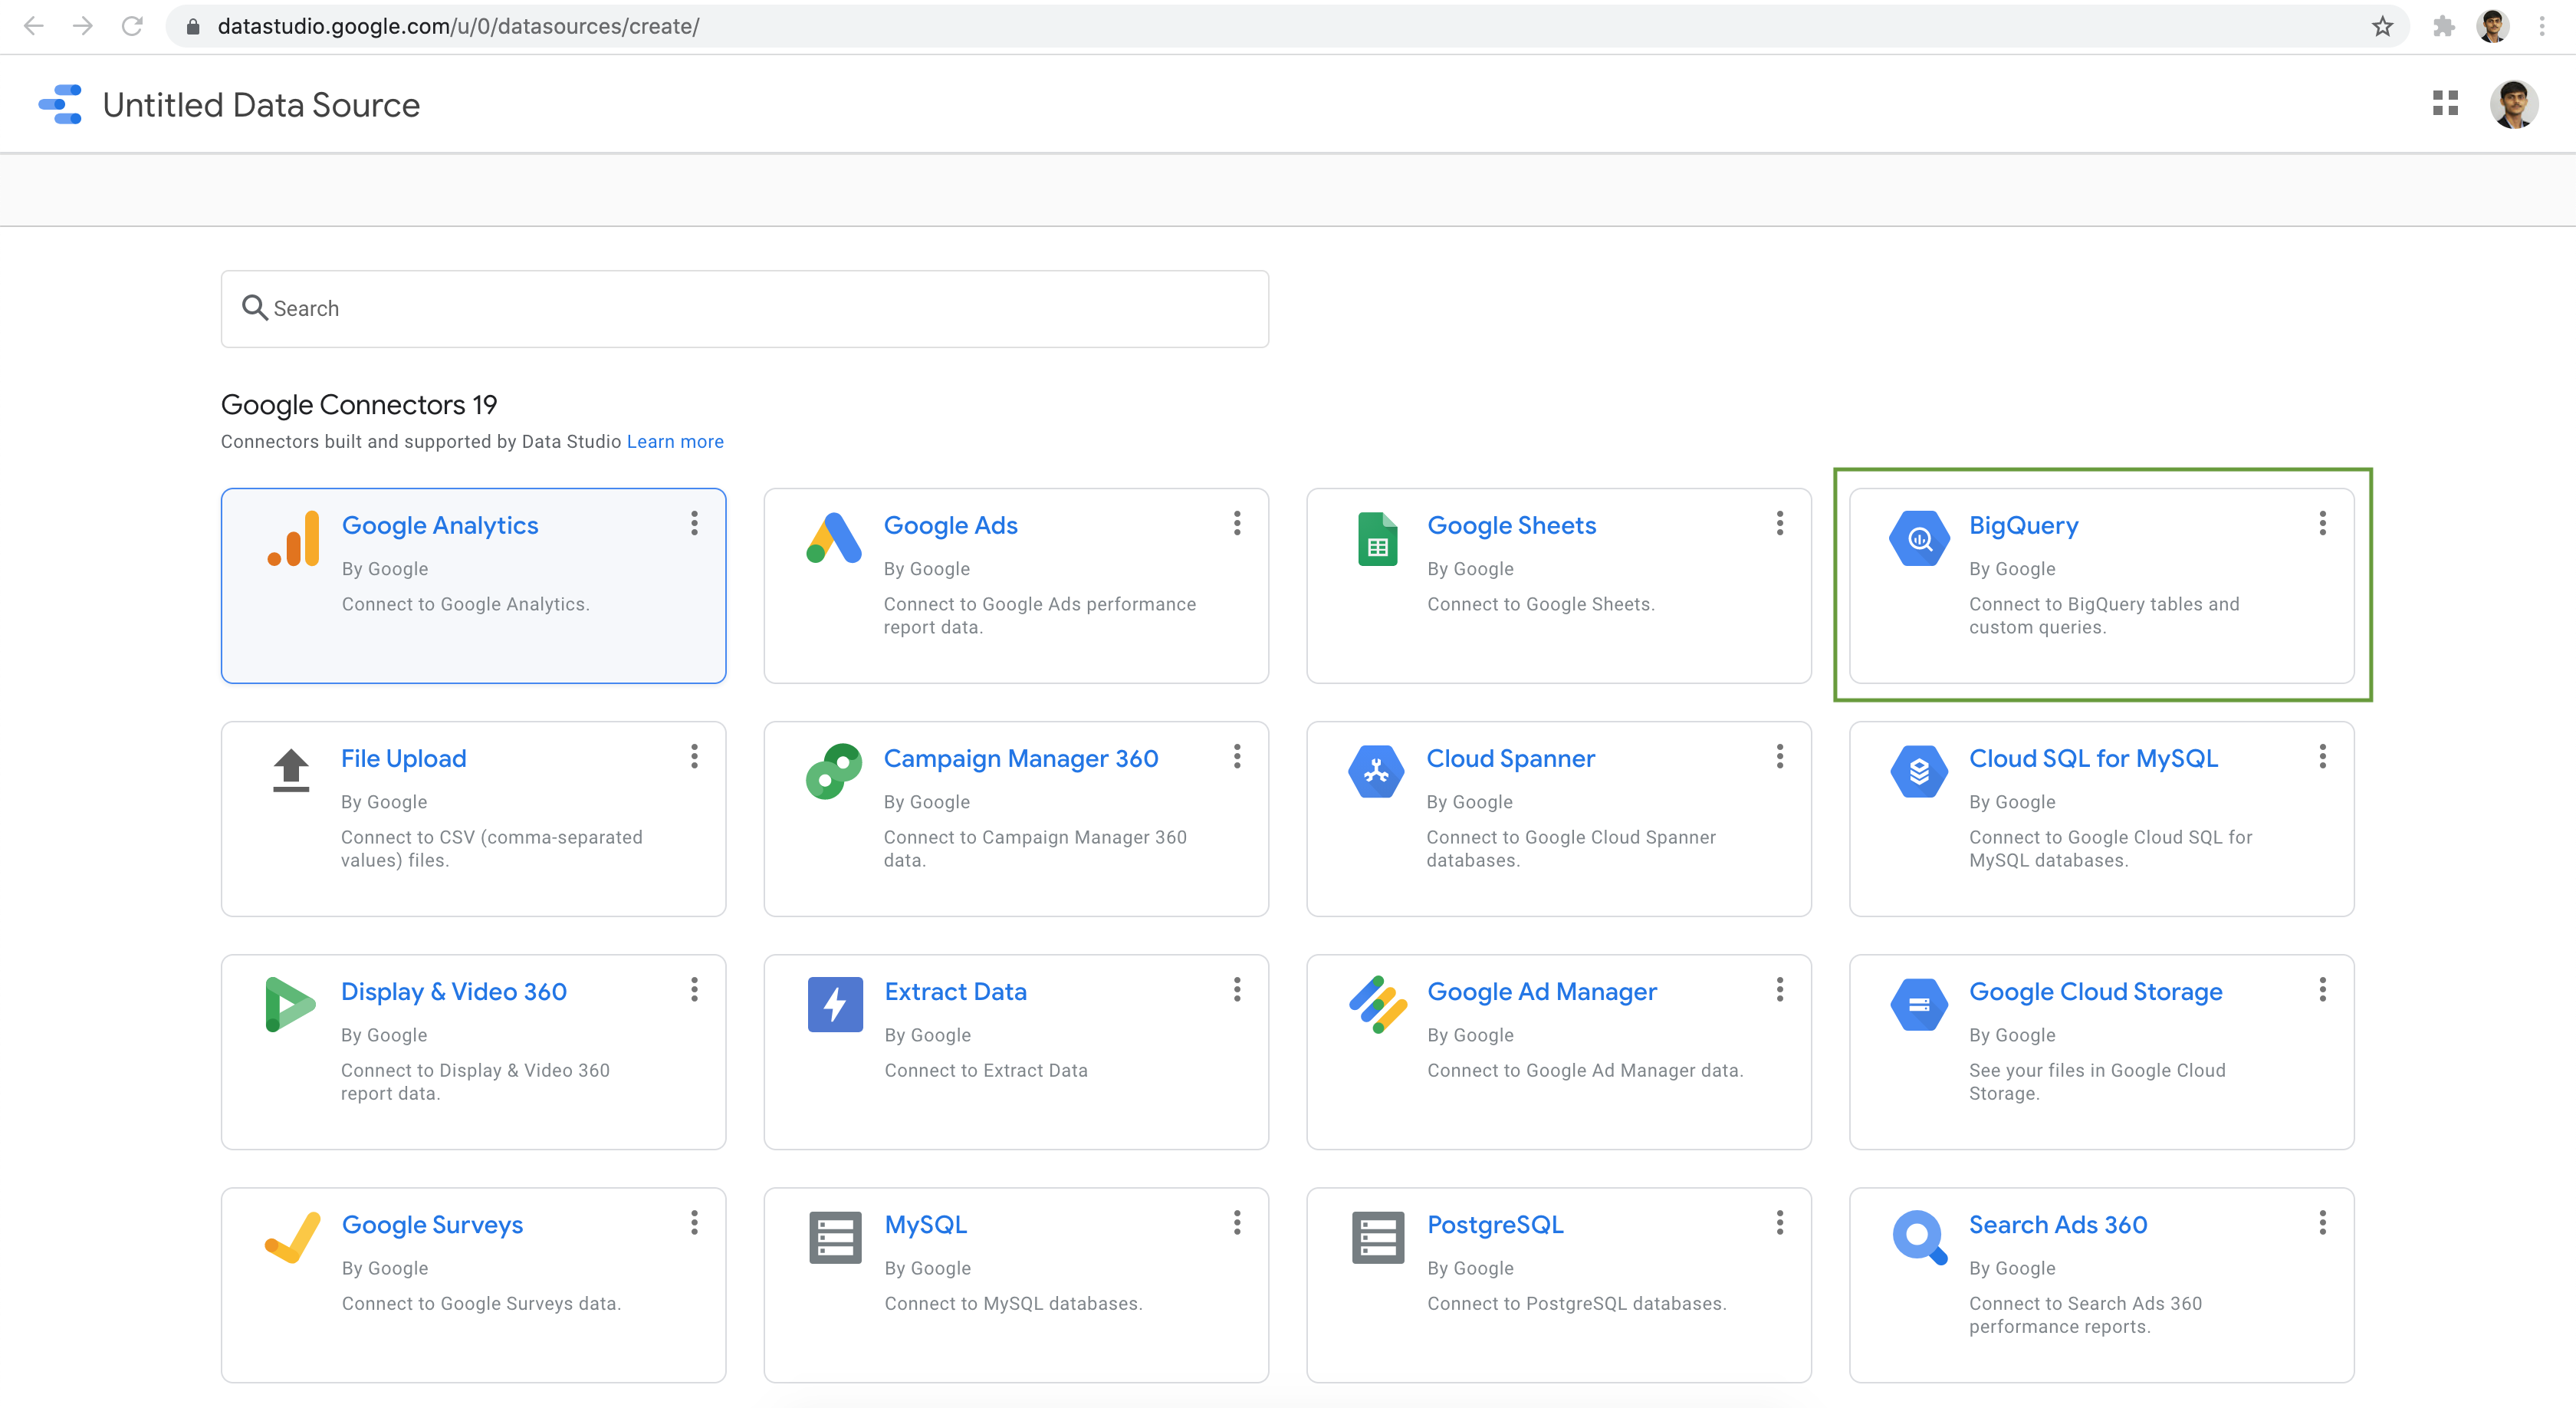
The Google Data Studio BigQuery connector lets us access data from your BigQuery tables within Google Data Studio.
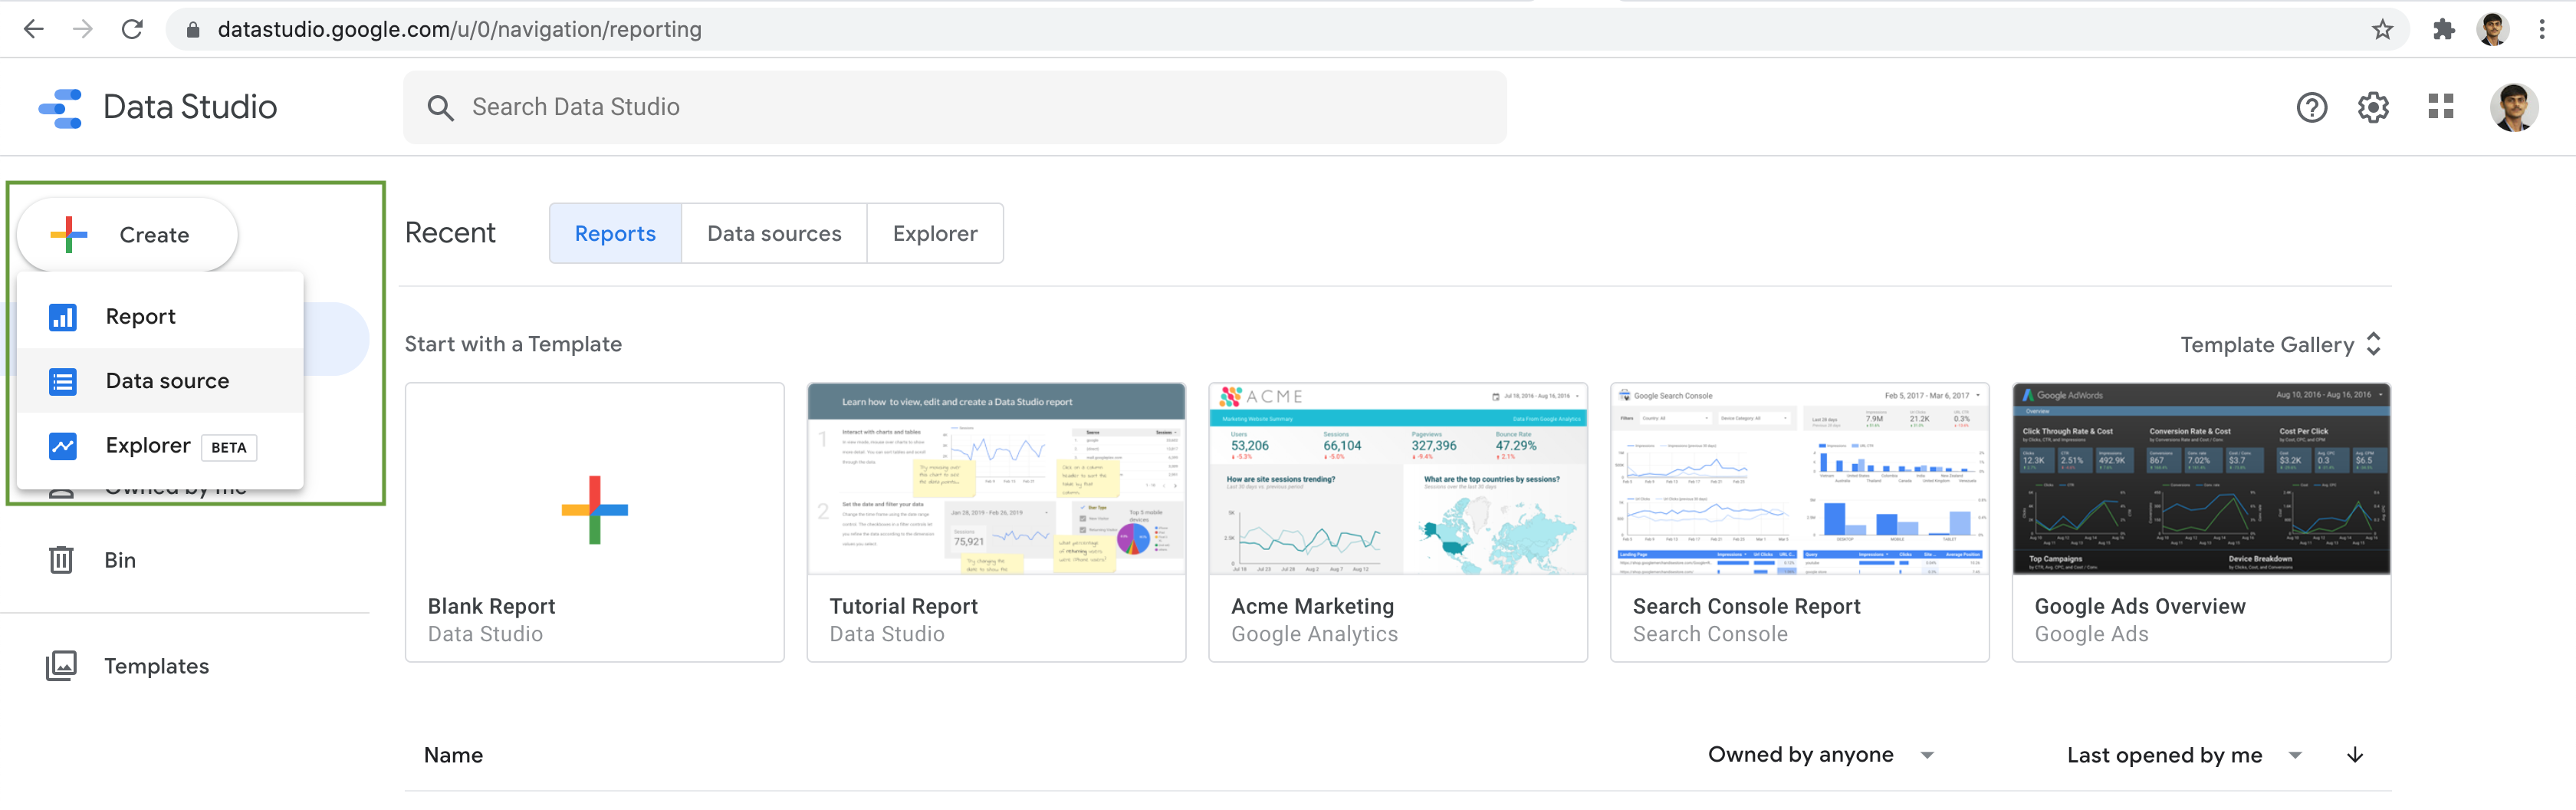
The first step in creating a report in Google Data Studio is to create a data source for the report. A report may contain one or more data sources. When you create a BigQuery data source, Google Data Studio uses the BigQuery connector.
https://datastudio.google.com/
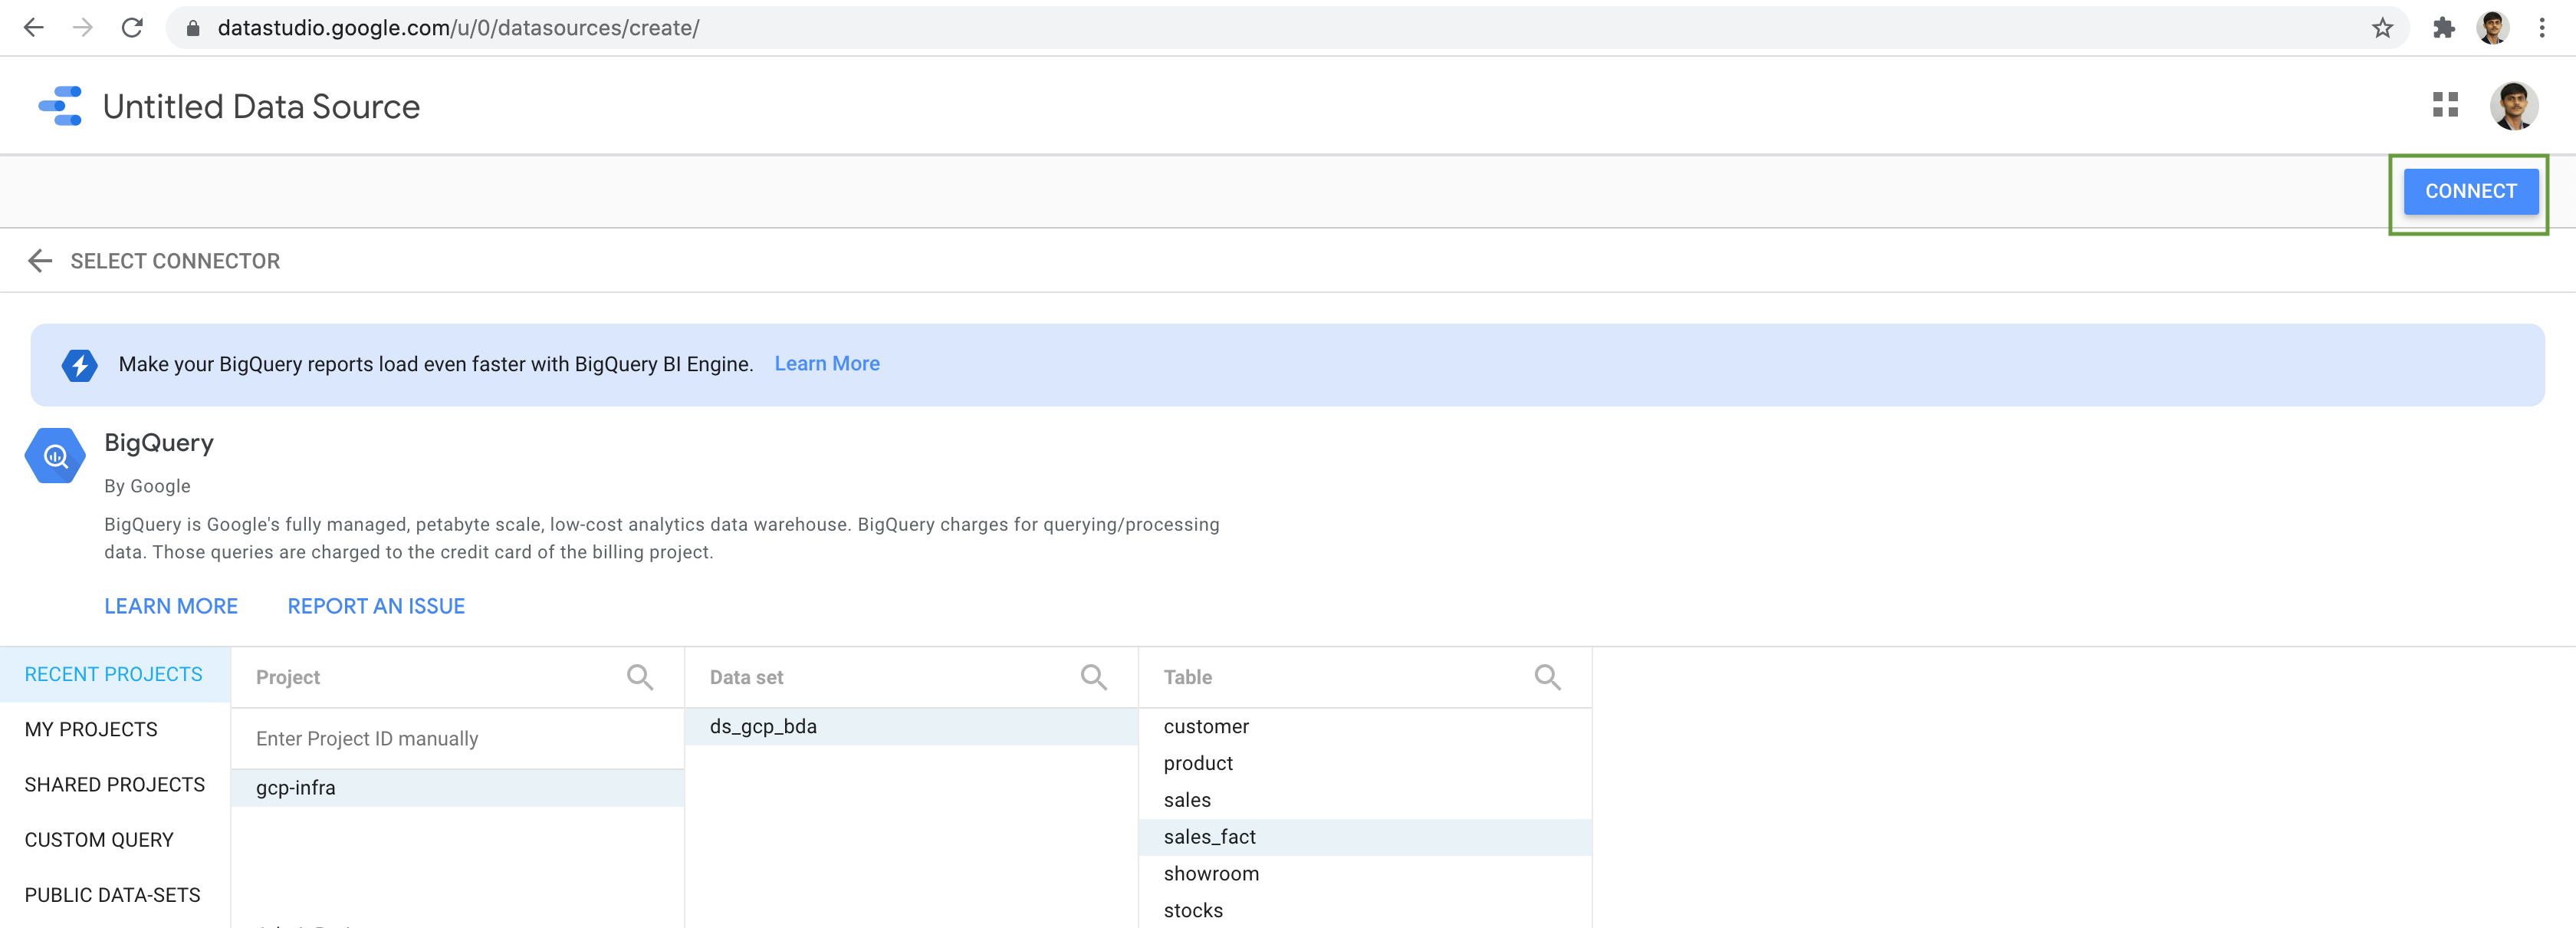
Select BigQuery connection as Data Source.
Navigation through our project, dataset & select the Sales Fact as the Table. Next click on the Connect button.
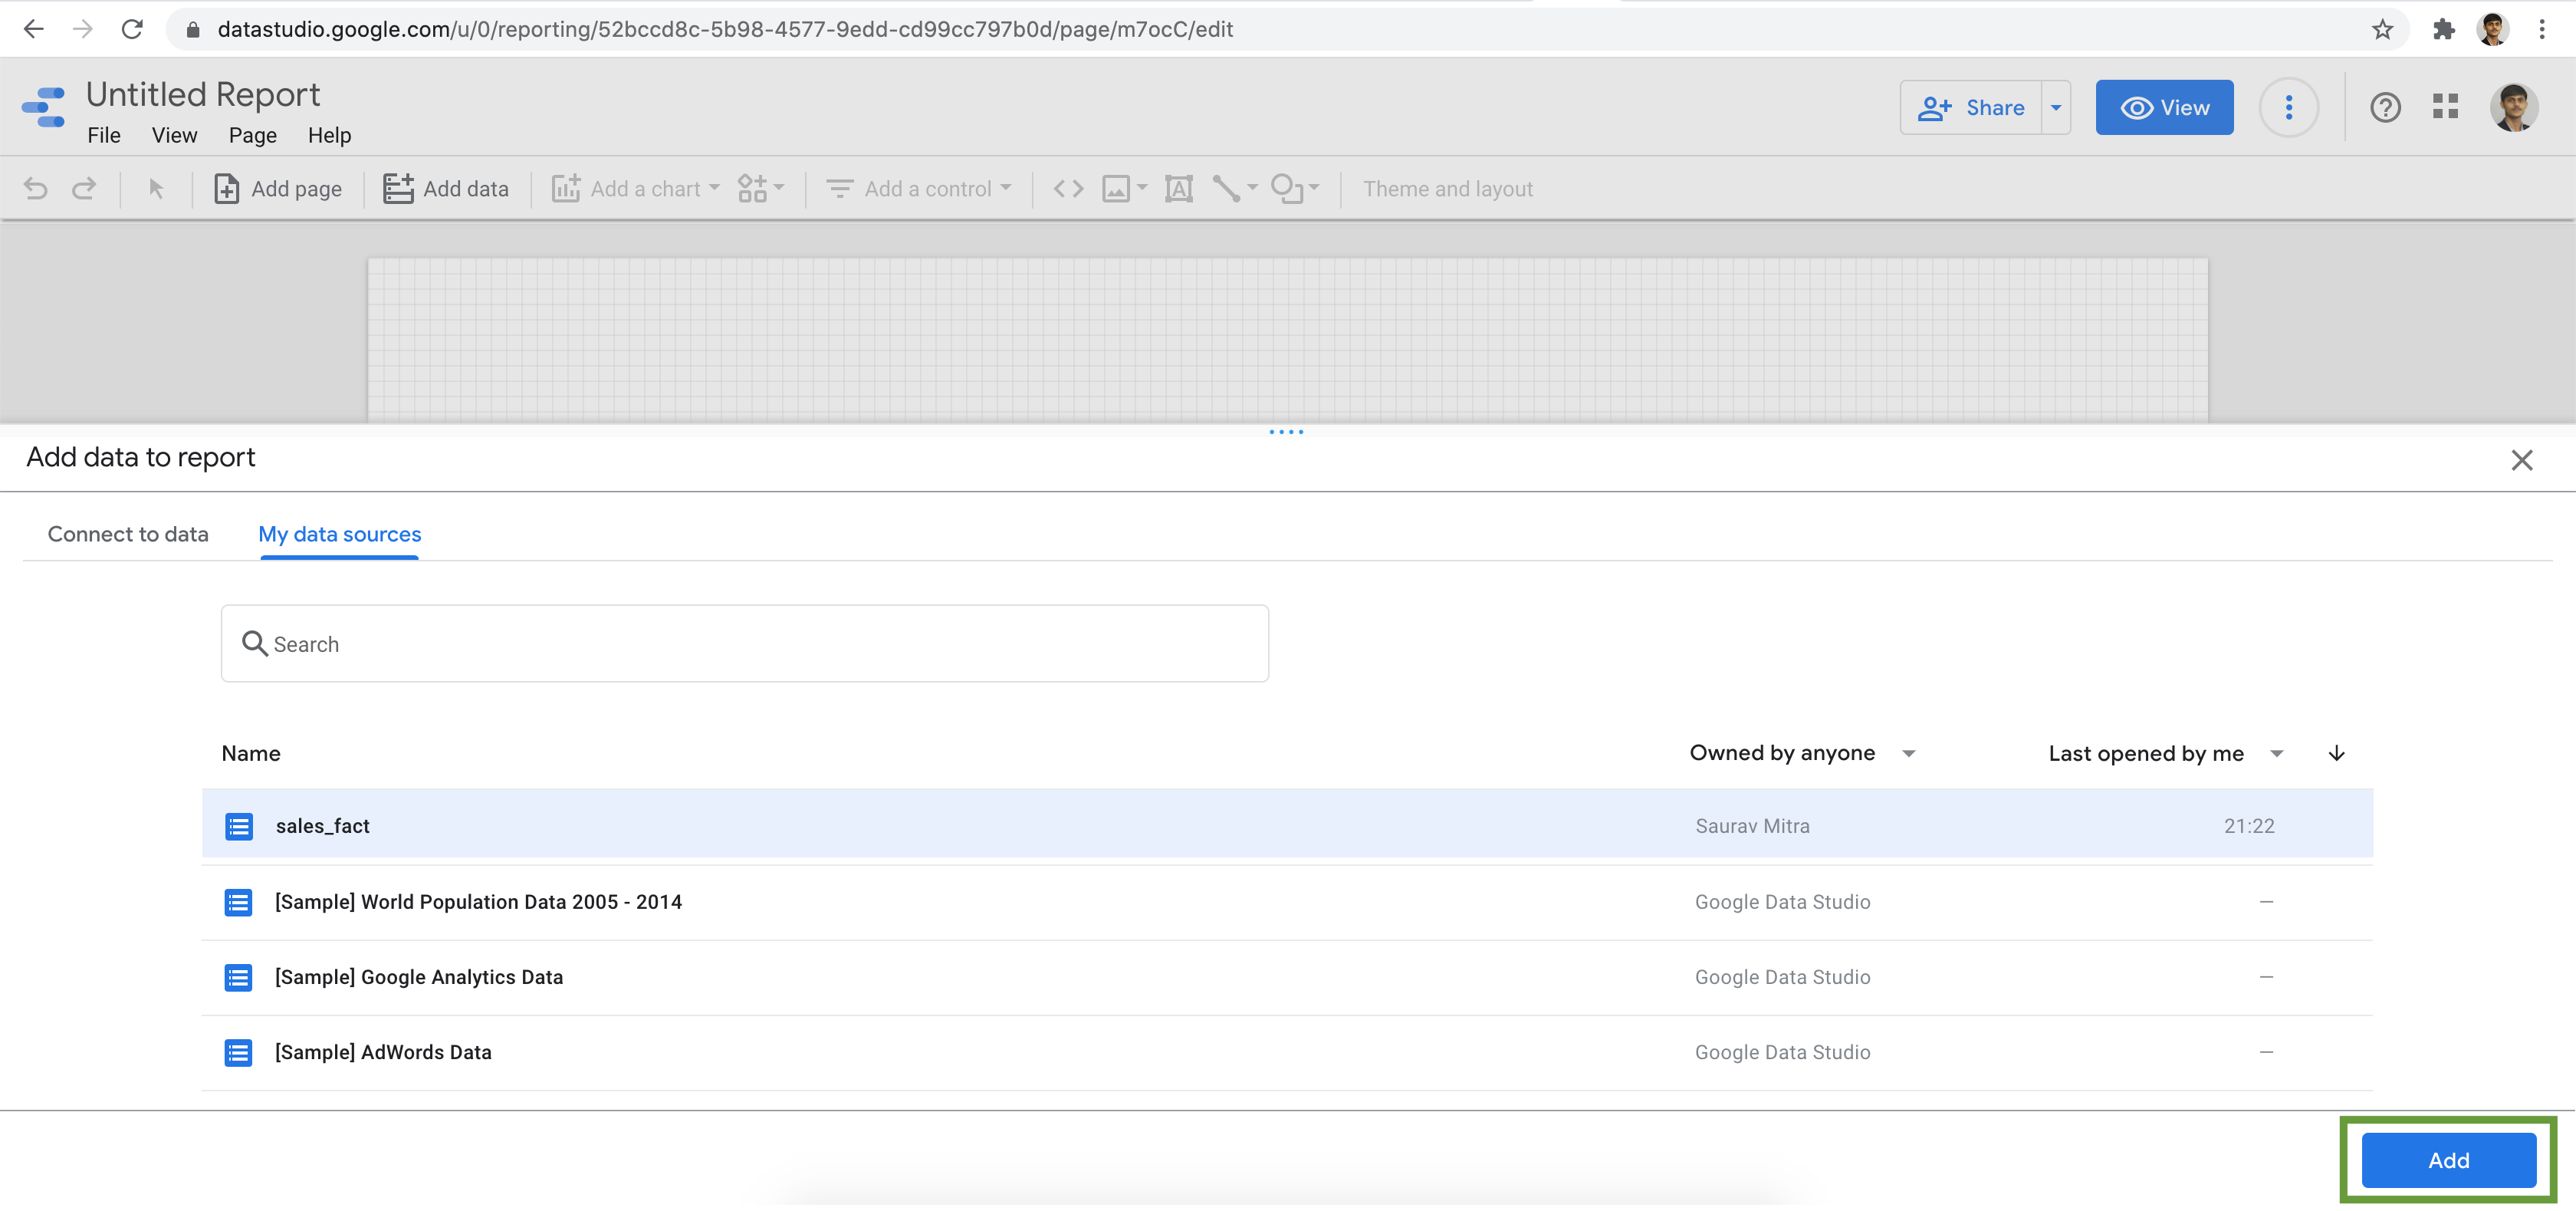
Select the Sales Fact Data Source & click on the Add button.
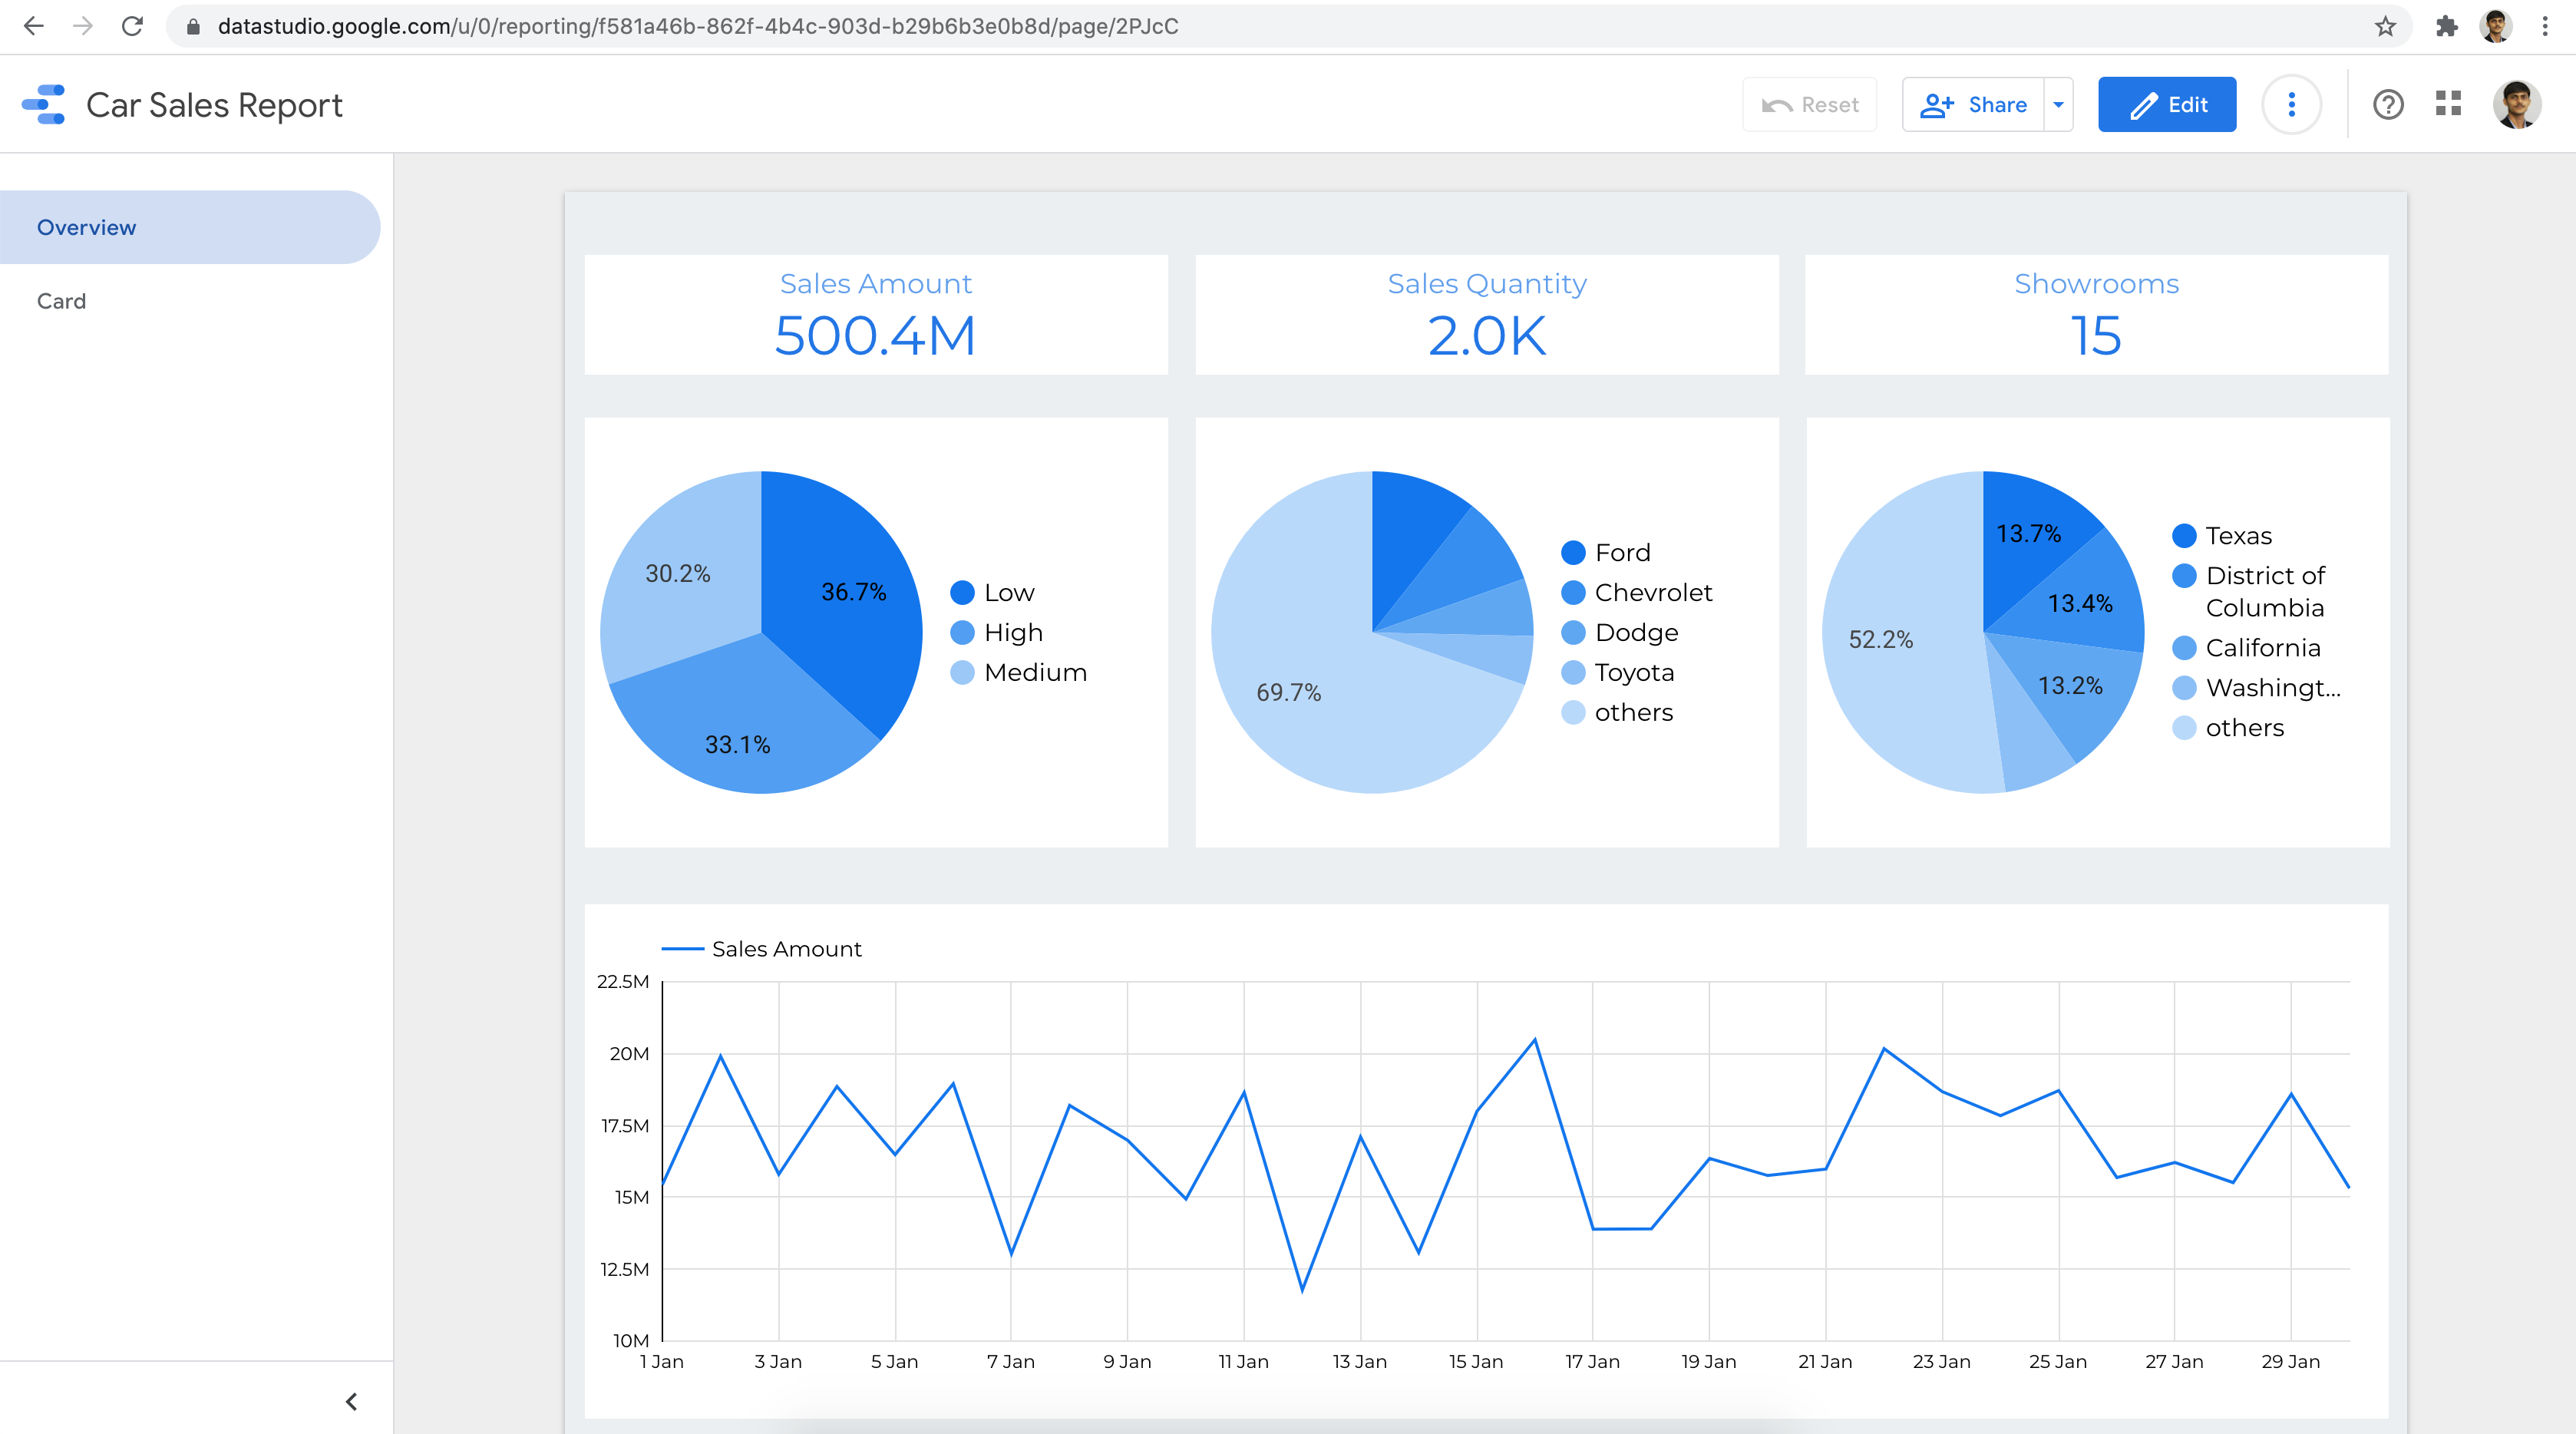
Add your charts & visualization to the report.
For Reference, we can use Terraform to provision all the GCP resources for this demo https://github.com/sarubhai/gcp-big-data-analytics